
How changes to the data change the mean, median, mode, range, and IQR

How measures of central tendency and spread are affected by changes to the data set
In this section, we want to see what happens to our measures of central tendency and spread when we make changes to our data set.
Specifically the changes made either by changing all the values in the set at once, or by adding a single data point to, or removing a single data point from, the data set.

Hi! I'm krista.
I create online courses to help you rock your math class. Read more.
Changing the entire data set
Shifting (addition and subtraction)
What happens to measures of central tendency and spread when we add a constant value to every value in the data set? To answer this question, let’s pretend we have the data set ???3,\ 3,\ 7,\ 9,\ 13???, and let’s calculate our measures for the set.
Mean: ???(3+3+7+9+13)/5=7???
Median: ???7???
Mode: ???3???
Range: ???13-3=10???
IQR: ???11-3=8???
If we add ???6??? to each data point in the set, the new set is ???9,\ 9,\ 13,\ 15,\ 19???. And our new measures of central tendency and spread are
Mean: ???(9+9+13+15+19)/5=13???
Median: ???13???
Mode: ???9???
Range: ???19-9=10???
IQR: ???17-9=8???
What we see is that adding ???6??? to the entire data set also adds ???6??? to the mean, median, and mode, but that the range and IQR stay the same.
And this will always be true. No matter what value we add to the set, the mean, median, and mode will shift by that amount but the range and the IQR will remain the same. The same will be true if we subtract an amount from every data point in the set: the mean, median, and mode will shift to the left but the range and IQR will stay the same.
So to summarize, whether we add a constant to each data point or subtract a constant from each data point, the mean, median, and mode will change by the same amount, but the range and IQR will stay the same.
Scaling (multiplication and division)
Let’s look at what happens when we multiply our data set by a constant value. Again starting with the set ???3,\ 3,\ 7,\ 9,\ 13???, the measures are
Mean: ???(3+3+7+9+13)/5=7???
Median: ???7???
Mode: ???3???
Range: ???13-3=10???
IQR: ???11-3=8???
Let’s multiply the set by ???2???, making the new set ???6,\ 6,\ 14,\ 18,\ 26???. The new measures of central tendency and spread are
Mean: ???(6+6+14+18+26)/5=14???
Median: ???14???
Mode: ???6???
Range: ???26-6=20???
IQR: ???22-6=16???
What we see is that multiplying the entire data set by ???2??? multiplies all five measures by ???2??? as well. The mean, median, mode, range, and IQR are all doubled when we double the values in the data set.
And this will always be true. No matter what value we multiply by the data set, the mean, median, mode, range, and IQR will all be multiplied by the same value. The same will be true if we divide every data point in the set by a constant value: the mean, median, mode, range, and IQR will all be divided by the same value.
So to summarize, if we multiply our data set by a constant value or divide our data set by a constant value, then the mean, median, mode, range, and IQR will all be scaled by the same amount.
Adding or removing a data point from the set
Mean
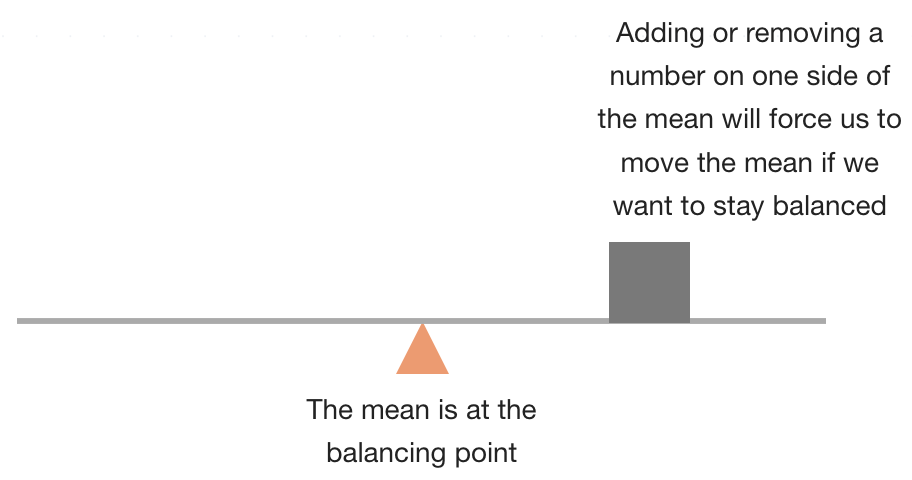
Thinking back to our discussion about the mean as a balancing point, we want to realize that adding another data point to the data set will naturally effect that balancing point. In fact, adding a data point to the set, or taking one away, can effect the mean, median, and mode.
If we add a data point that’s above the mean, or take away a data point that’s below the mean, then the mean will increase. If take away a data point that’s above the mean, or add a data point that’s below the mean, the mean will decrease.
Median
If we add or remove a data point from the set, it can effect the median, but it may not. In the set ???1,\ 2,\ 3,\ 4,\ 4,\ 6,\ 6???, the median is ???4???. If we take out ???3???, the median of ???1,\ 2,\ 4,\ 4,\ 6,\ 6??? is still ???4???; it’s unchanged. But if we take out a ???6???, the median of ???1,\ 2,\ 3,\ 4,\ 4,\ 6??? is now ???3.5???; it changes. The same will be true for adding in a new value to the data set. Depending on the value, the median might change, or it might not.
Effect on the mean vs. median
It’s also important that we realize that adding or removing an extreme value from the data set will affect the mean more than the median.
Let’s take an easy example, and use the data set ???1,\ 2,\ 3???. The mean is ???2??? and the median is ???2???. Let’s add a huge value to the data set, like ???1,000???, so that the new data set is ???1,\ 2,\ 3,\ 1,000???. The mean of this new data set is about ???252???, and the median of the new data set is ???2.5???.
What we see is that adding an extreme value to the data set barely had any effect on the median at all: it went up from ???2??? to ???2.5???. But adding the new value had an enormous effect on the mean: it shifted the mean from ???2??? up to ???252???.
How mean, median, and mode are shifted by changes in the data set


Take the course
Want to learn more about Probability & Statistics? I have a step-by-step course for that. :)
The effect of removing one outlier data point from the set
Example
Let’s say we play a round of golf with three friends, and our scores are the set ???70,\ 71,\ 71,\ 103???. What effect does removing the ???103??? have on the mean and median of the set?
In a set like this one, we have a few data points clustered tightly together, and then a data point that is much different than the others. Removing the data point that’s far from the cluster effects the mean and median in interesting ways. We can see that the median of the set is ???71???, and we can calculate that the mean is
???\mu=\frac{70+71+71+103}{4}=\frac{315}{4}\approx79???

No matter what value we add to the set, the mean, median, and mode will shift by that amount but the range and the IQR will remain the same.
If we remove the ???103??? from the data set, the median doesn’t change at all because the median of the set ???70,\ 71,\ 71??? is still ???71???. But the mean will change significantly. The new mean is
???\mu=\frac{70+71+71}{3}=\frac{212}{3}\approx71???
Which makes sense, because the single data point of ???103??? would tend to skew the data more by bringing up the average. So when it’s removed, the mean drops back down to a value that more accurately reflects most of the scores. On the other hand, the ???103??? barely changes the median, which is why the median didn’t change when we removed the ???103???.
A number that has the power to change a data set in this way is called an outlier; it’s a number on the extreme upper end or extreme lower end of a data set.
Mode
The mode could also be effected by adding a data point or taking one away. For example, in the set ???1,\ 2,\ 3,\ 4,\ 4,\ 6,\ 7???, we could add a ???4??? and it wouldn’t change the mode. We could also take away a ???2???, and it wouldn’t change the mode. But, if we were to take away a ???4???, the mode of the set would change from ???4??? to the set having no mode at all.
