
Graphing linear equations
Pieces of the slope-intercept form of the equation of a line
A linear equation is the equation of a line. When you graph a linear equation, it’s best to write the equation in slope-intercept form: ???y=mx+b???.
Remember that ???m??? is the slope of the line and ???b??? is the ???y???-intercept (the ???y???-coordinate of the point at which the line crosses the ???y???-axis).

Hi! I'm krista.
I create online courses to help you rock your math class. Read more.
If we write the equation in the form ???y=mx+b???, we can first plot the ???y???-intercept and then use the slope to find another point on the line.
Technically, you need only two points to create a straight line, but plotting three or four points will create a more accurate graph if you’re graphing by hand.
How to graph the equation of a line


Take the course
Want to learn more about Algebra 1? I have a step-by-step course for that. :)
Finding the y-intercept from slope-intercept form
Example
What is the ???y???-intercept of the line?
???y=-\frac{2}{3}x???
This equation is in slope-intercept form, but the ???y???-intercept is missing. However, we could actually rewrite the equation of the line as
???y=-\frac{2}{3}x+0???
Written this way, we haven’t changed the value of either side of the equation at all, but we can see that the ???y???-intercept is ???0???.
Let’s look at an example of graphing linear equations.

Technically, you need only two points to create a straight line, but plotting three or four points will create a more accurate graph if you’re graphing by hand.
Example
Graph the line.
???y=3x-2???
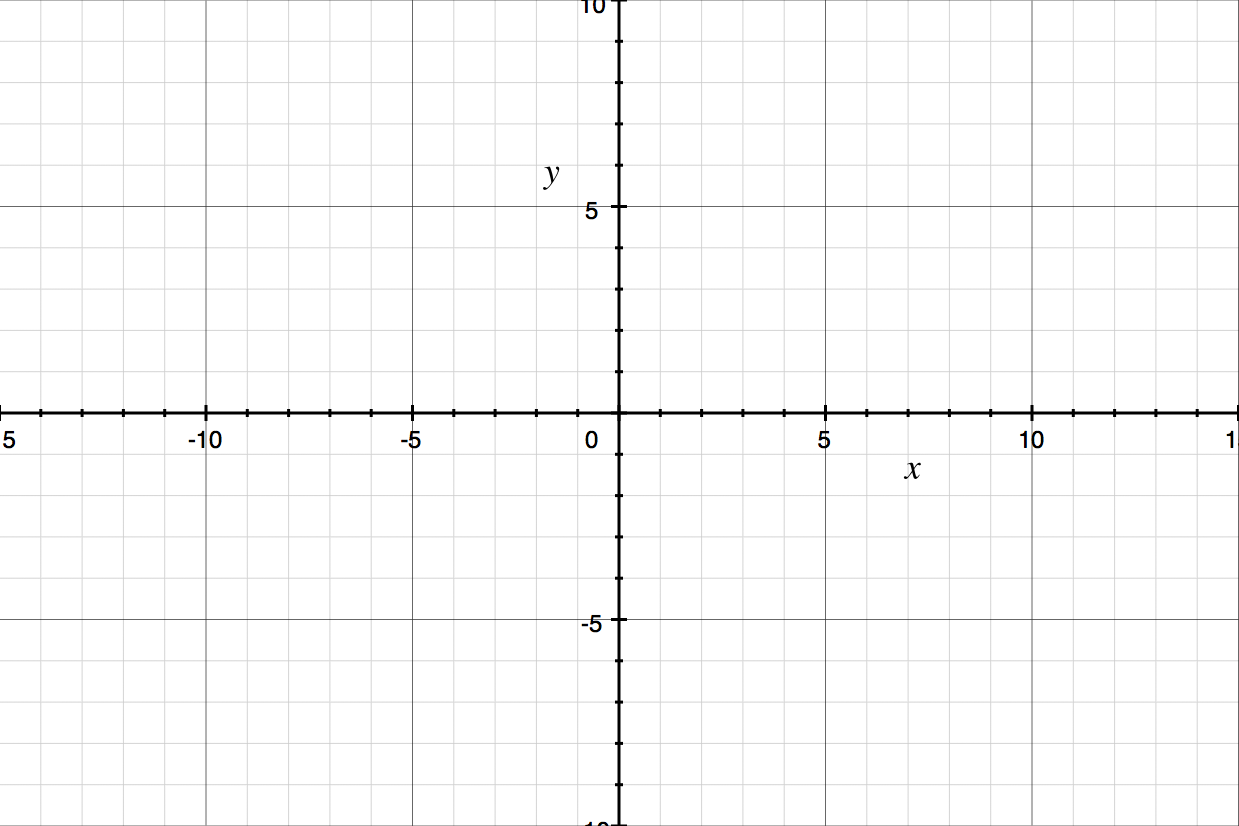
This equation is in slope-intercept form, so it’s ready to be graphed. Start by drawing a Cartesian coordinate system. Make sure to label the ???x???- and ???y???-axes and the tick marks. Tick marks are the very, very short lines that are equally spaced along the axes. We label the tick marks with numbers, to indicate the values of ???x??? and ???y??? at the locations of the tick marks on the ???x???- and ???y???-axes, respectively.
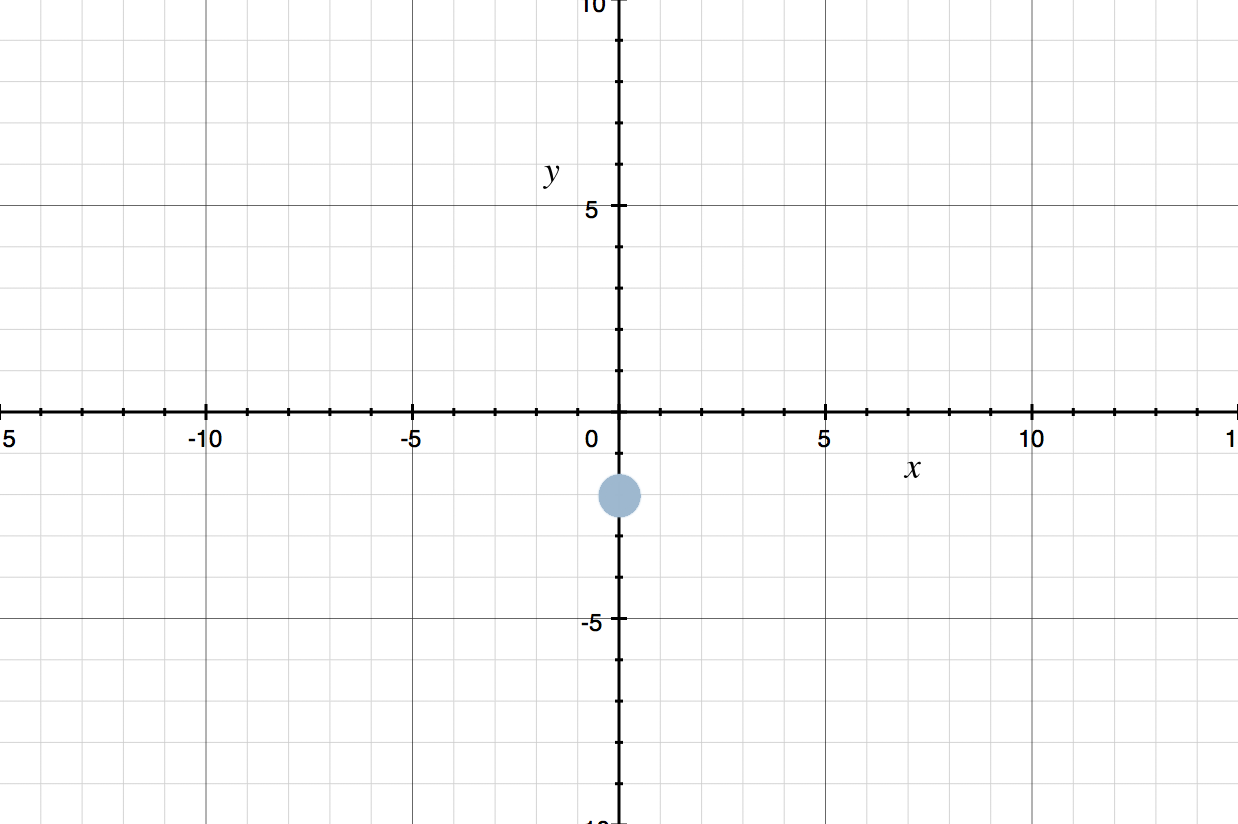
Next, plot the ???y???-intercept (???b??? in the equation). The ???y???-intercept in this case is ???-2???, which means that the point will be at ???-2??? on the ???y???-axis (down ???2??? from the origin).
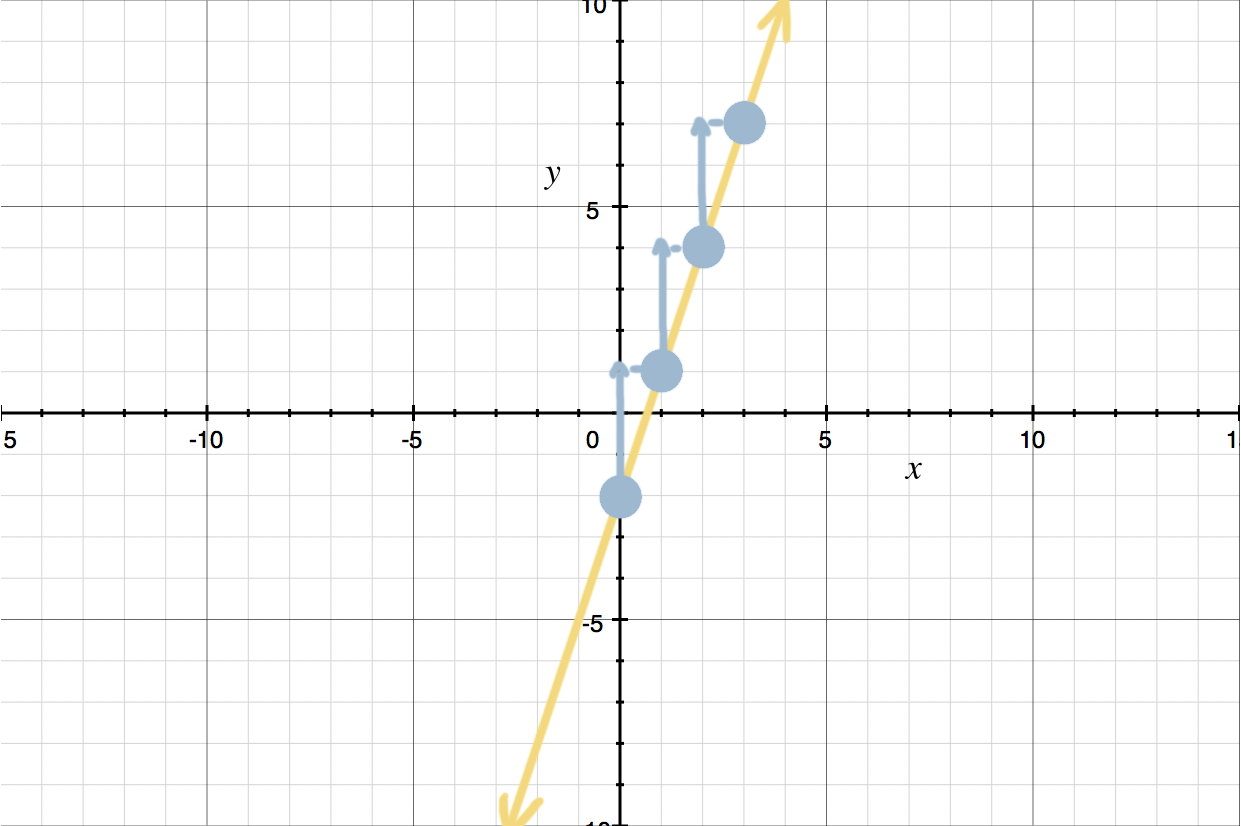
Next, use the slope (???m??? in the equation) to find more points on the graph. A good practice is to go up (if the slope is positive) or down (if the slope is negative) for the rise, and then go to the right for the run. Once you’re comfortable doing this, you can “go backwards” by going up (if the slope is negative) or down (if the slope is positive) for the rise, and then going to the left for the run.
Since our slope is positive ???3??? (which can be written as ???3/1???), we’ll start at the ???y???-intercept and go up ???3??? units and to the right ???1??? unit. We will:
Plot three to four points for accuracy
Connect the dots with a straight line and extend the line past the points
End the line with arrows in both directions since the equation of a line extends to infinity (it continues forever in both directions)
Let’s try another example of graphing linear equations.
Example
Write the equation of the line whose graph is shown.
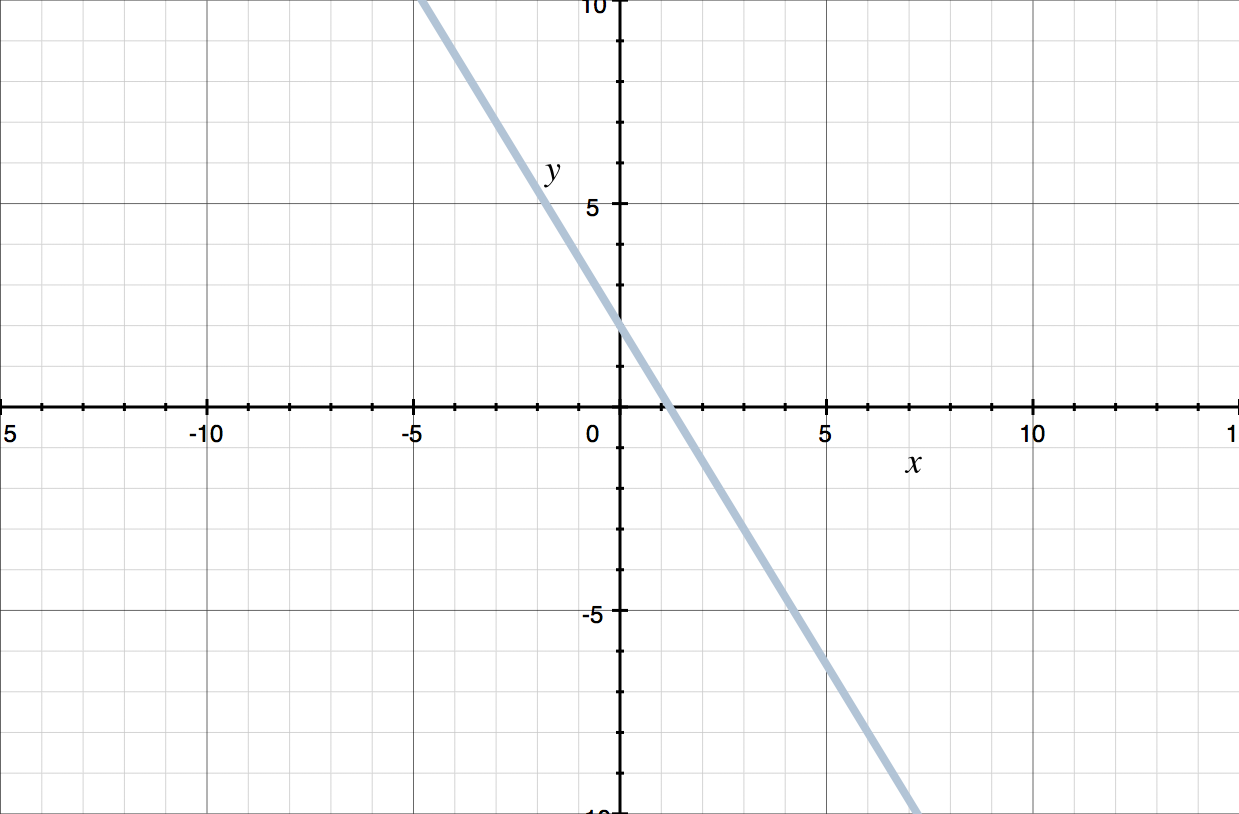
First, identify the ???y???-intercept. In this case the graph of the line crosses the ???y???-axis at ???2???. Next, we’ll find the slope by identifying another clear point on the graph, such as ???(3,-3)???. To get from the ???y???-intercept to the point ???(3,-3)???, we’ll go ???5??? units down and then ???3??? units to the right, so the slope is ???-5/3???.
Now that we have the ???y???-intercept (???b=2???), and the slope (???m=-5/3???), we can write the equation of the line in slope-intercept form.
???y=-\frac{5}{3}x+2???
