How to find Mean, variance, and standard deviation

Population vs. sample
Before we dive into standard deviation and variance, it’s important for us to talk about populations and population samples. A population is the entire group of subjects that we’re interested in. A sample is just a sub-section of the population.

Hi! I'm krista.
I create online courses to help you rock your math class. Read more.
So, as an example, if we’re interested in data about polar bears in the arctic, the population would be every single polar bear in that region. It would be very difficult, if not impossible, for us to ensure we’d looked at every polar bear. So we might choose instead to take a sample of the population, maybe only ???25??? bears, and use the data we collect about that smaller group in order to draw conclusions about the population as a whole.
If, on the other hand, we were interested in data about all the students in our math class, there might only be ???30??? other students, so it might be very reasonable for us to collect data about the entire population.
It’s important to know whether we’re talking about a population or a sample, because in this section we’ll be talking about variance and standard deviation, and we’ll use different formulas for variance and standard deviation depending on whether we’re using data from a population or data from a sample.
In all the formulas we use that involve a count of the number of subjects or participants, we’ll denote the number of subjects in a population as capital ???N???, and the number of subjects in a sample as lowercase ???n???.
How to calculate mean, variance, and standard deviation


Take the course
Want to learn more about Probability & Statistics? I have a step-by-step course for that. :)
Formula for the mean
We learned previously that the formula for the mean of a population was
???\mu=\frac{\sum_{i=1}^n x_i}{n}???
Now that we’re a little more advanced and we want to start distinguishing between populations and samples, let’s update the mean formula and say that the mean of a population is
???\mu=\frac{\sum_{i=1}^N x_i}{N}???
The mean of a population is still defined as ???\mu???, but we’ll define the mean of a sample with ???\bar{x}???, pronounced “x-bar”:
???\bar{x}=\frac{\sum_{i=1}^n x_i}{n}???
Notice the capital ???N??? in the population formula and the lowercase ???n??? in the sample formula. Remember the capital ???N??? means you have included everyone (the population), and the lowercase ???n??? means you have selected just a few individuals (the sample).
Formulas for variance
Standard deviation is the measure of how far the data is spread from the mean, and population variance for the set measures how the points are spread out from the mean.
Population variance is given by ???\sigma^2??? (pronounced “sigma squared”). The reason we define the population variance formula in terms of ???\sigma^2??? is because doing so will help us with some concepts we’ll learn later on. The formula for population variance is:
???\sigma^2=\frac{\sum_{i=1}^N (x_i-\mu)^2}{N}???
Notice that ???\mu??? is the population mean, which means that ???x_i-\mu??? gives the distance of each point from the mean, which is the deviation of each point. Then ???(x_i-\mu)^2??? is the squared deviation, we’re summing together all those squared deviations in the numerator, and then we’re dividing that result by the number of objects in the population, ???N???, in order to get population variance, ???\sigma^2???.
Finding sample variance is a very similar process to finding population variance, but we use a slightly different formula:
???S^2=\frac{\sum_{i=1}^n (x_i-\bar{x})^2}{n}???
Notice that the formula for sample variance, ???S^2???, is identical to the formula for population variance, except that we’ve swapped out ???\mu??? for ???\bar{x}??? (since ???\bar{x}??? is sample mean, whereas ???\mu??? is population mean), and we’ve changed ???N??? to ???n??? (since ???n??? refers to sample size, whereas ???N??? refers to population size).
But we need to be really careful here. While this sample variance formula is correct, it’s not usually the one we use, because it’s actually not that accurate. We won’t go into detail about why it’s not super accurate, but we’ll say that, because it’s not that accurate, we usually say that the formula above gives biased sample variance.
Interestingly, the easy way to make the sample variance formula a lot more accurate is to divide by ???n-1??? instead of ???n???. Dividing by ???n??? will underestimate sample variance, and dividing by ???n-2??? will overestimate sample variance. In other words, the better formula for sample variance, and therefore the one we want to use is
???S^2=\frac{\sum_{i=1}^n (x_i-\bar{x})^2}{n-1}???
We say that this formula gives us the unbiased sample variance. Sometimes, in order to distinguish these formulas from one another, you’ll see them written as
???S_n^2=\frac{\sum_{i=1}^n (x_i-\bar{x})^2}{n}??? for biased sample variance
and
???S_{n-1}^2=\frac{\sum_{i=1}^n (x_i-\bar{x})^2}{n-1}??? for unbiased sample variance
However, because the formula for unbiased sample variance always gives us a more accurate figure for the variance of a sample, very often we won’t worry about indicating the left-hand side of the formula as ???S_n??? or ???S_{n-1}???, because we just assume that we always want unbiased sample variance. And therefore, we agree that the formula we always want to use for sample variance is this one:
???S^2=\frac{\sum_{i=1}^n (x_i-\bar{x})^2}{n-1}???

Be careful to distinguish between biased and unbiased sample variance
Formulas for standard deviation
Standard deviation is a measure of how much the data in a set varies from the mean. The larger the value of standard deviation, the more the data in the set varies from the mean. The smaller the value of standard deviation, the less the data in the set varies from the mean.
Population standard deviation is the positive square root of population variance. Since population variance is given by ???\sigma^2???, population standard deviation is given by ???\sigma???.
???\sigma=\sqrt{\sigma^2}=\sqrt{\frac{\sum_{i=1}^N (x_i-\mu)^2}{N}}???
So when you want to calculate the standard deviation for a population, just find population variance, and then take the square root of the variance, and you’ll have population standard deviation.
Similarly, we’ll find sample standard deviation by taking the square root of unbiased sample variance (the one we found by dividing by ???n-1???. Since sample variance is given by ???S^2???, sample standard deviation is given by ???S???.
???S=\sqrt{S_{n-1}^2}=\sqrt{\frac{\sum_{i=1}^n (x_i-\bar{x})^2}{n-1}}???
Keep in mind that, even though we start with unbiased sample variance, when we take the square root to find sample standard deviation, we reintroduce some bias into the value. The amount of bias in the sample standard deviation just depends on the kind of data in the data set.
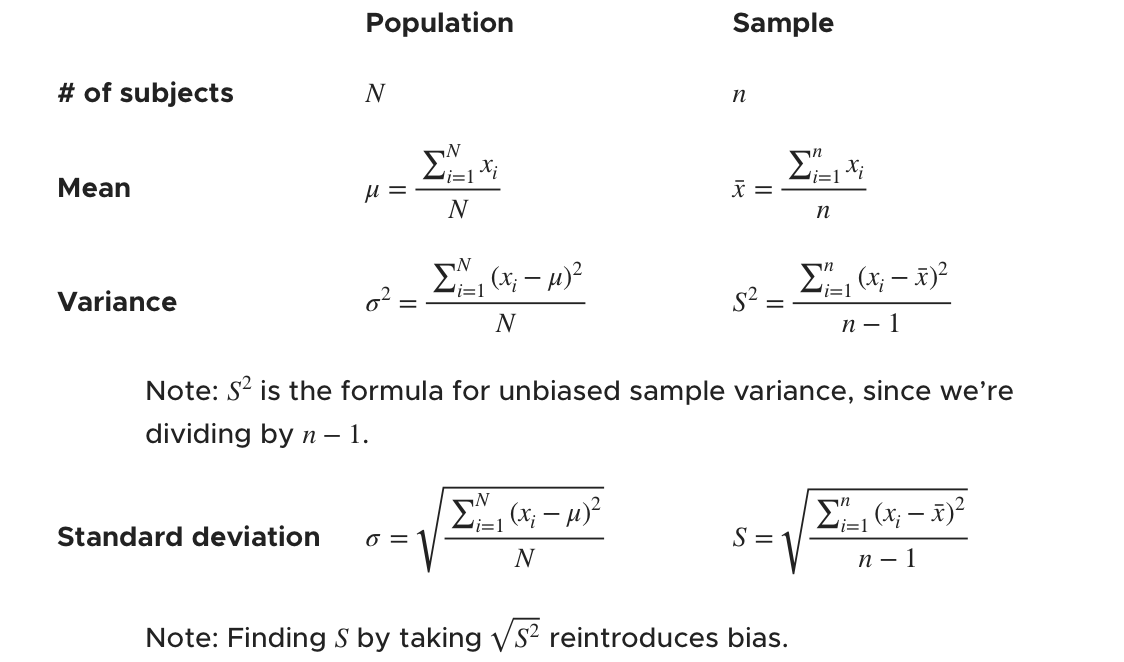
Here’s a table that summarizes the formulas from this section.