
All about one-way data tables for statistics

Building one-way data tables of quantitative or categorical data
Individuals and variables
The simplest kind of information we’ll work with in this course is a set of individuals with one or more properties, called variables.
The individuals are the items in the data set and can be cases, things, people, etc.

Hi! I'm krista.
I create online courses to help you rock your math class. Read more.
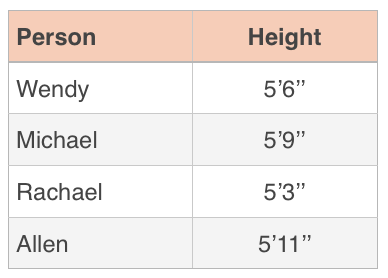
In this table for “heights of people in the car,” the individuals are the people, and their heights are a variable because height is a property of each individual.
Together, individuals and variables are called data. When we organize data into a table like this one, we call it a data table. Here’s an example of a data table about ice cream:
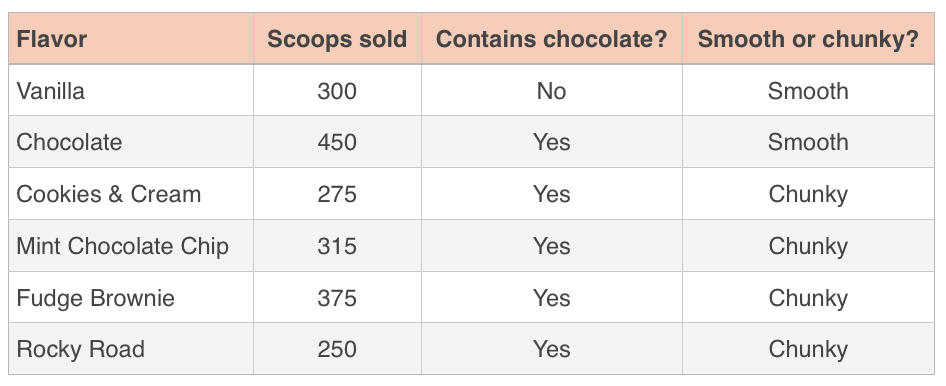
The individuals are the flavors: Vanilla, Chocolate, Cookies & Cream, etc., and the variables are their properties: Scoops sold, Contains chocolate, and Smooth or chunky.
Variables can be categorial or quantitative. In the table for “heights of people in the car,” there’s one quantitative variable: the height. In the table for “ice cream shop data for July,” there’s one quantitative variable (scoops), and two categorical variables (contains chocolate and smooth or chunky).
• Categorial variables are non-numerical variables. Their values aren’t represented with numbers. Whether or not the ice cream contains chocolate, and whether the ice cream is smooth or chunky are categorical variables. This is because the values there are words, not numbers.
• Quantitative variables are numerical variables. Their values are numbers. The height of the people in the car and the number of scoops of ice cream sold are quantitative variables, because the values there are numbers.
This kind of data is called one-way data, because we have just a single individual, like Michael in the car, or Cookies & Cream in the ice cream shop, that then has properties attached to it.
Constructing a table
When you construct a table, you want to think about whether you have more individuals or more variables. In the two tables we looked at, we had the individuals listed down the left-hand side, and the variables listed across the top.
But if you have lots of variables but only a few individuals, it can be helpful to list the individuals across the top and the variables down the left side. For example, if you’re comparing lots of information about two houses for sale in the same neighborhood, you might make a table like this:
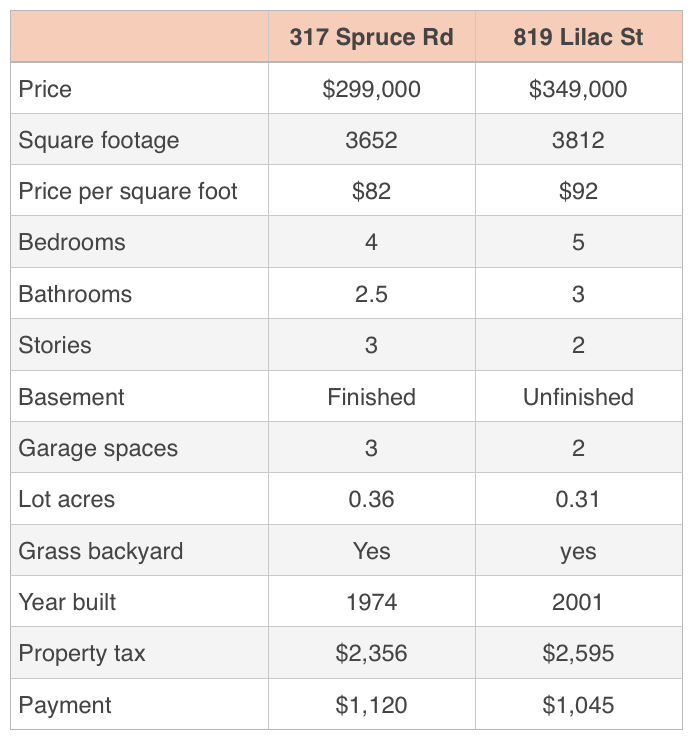
The individuals are the addresses listed across the top of the table, ???317??? Spruce Road and ???819??? Lilac Street. All the variables are listed down the left side of the table. Since there are so many more variables than individuals, listing the variables vertically makes the table fit better on paper than if we had tried to list all the variables horizontally.


