
Relative frequency tables

How to change two-way tables in relative frequency tables
We’re familiar now with displaying data in a two-way table.

Hi! I'm krista.
I create online courses to help you rock your math class. Read more.
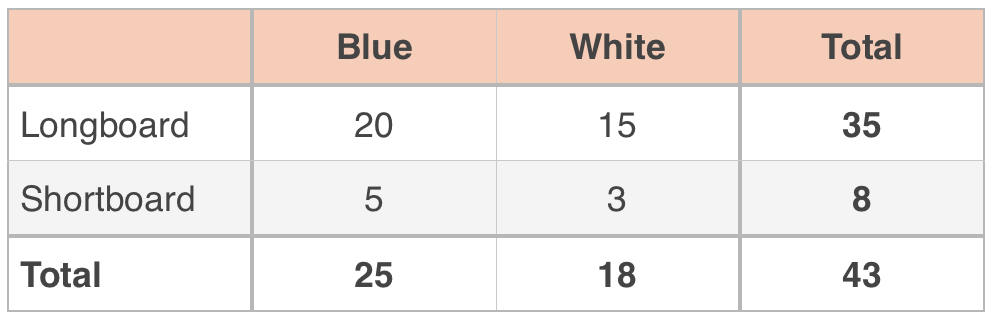
For example, we might categorize the surfboards at Ricky’s surf shop by length and by color.

But sometimes it’s helpful to express the data in a two-way table as percentages. For example, of all the blue surfboards in Ricky’s surf shop, what percentage of them are longboards, and what percentage of them are shortboards?
If we want to express these percentages, then we just need to change the two-way table into what’s called a relative frequency table, which is a table that shows percentages instead of actual counts.
So to answer our question from earlier, we know from our table that there are ???20+5=25??? total blue surfboards, which means that ???20/25=0.8=80\%??? of the blue surfboards are longboards. And ???5/25=0.2=20\%??? of the blue surfboards are shortboards. We could do the same calculations for the white surfboards:
Longboards: ???15/(15+3)=15/18=0.8\overline{3}\approx83\%???
Shortboards: ???3/(15+3)=3/18=0.1\overline{6}\approx17\%???
So we could change the table from one that just shows a count of surfboards, into a relative frequency table that shows the percentage of longboards and shortboards based on color.

Now we can see that out of all the blue surfboards, ???80\%??? of them are longboards and ???20\%??? of them are shortboards. And out of all the white surfboards, about ???83\%??? are longboards and ???17\%??? are shortboards.
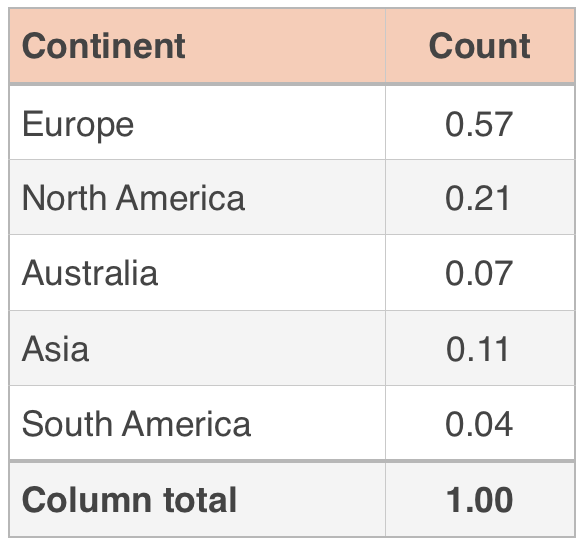
We could also create a relative frequency table for one-way data. Using the table from a previous section about the number of times each continent has played host to the summer Olympic games,

we could turn this table into a relative frequency table.
Rows vs. columns
Notice that because we found the percent of the total within each column, that we were able to add a “Column total” to the bottom of the surfboard table. Each column sums to ???1.00???.
???0.80+0.20=1.00???
???0.83+0.17=1.00???
That’s because in each cell, we found the percentage of the total for the column, and so each column sums up to ???100\%???. Therefore, the table we made is actually called a column-relative frequency, where the columns sum to ???1.00??? but the rows do not.
But we could have just as easily created a row-relative frequency by converting the rows into percentages instead of the columns into percentages.
We’ll start again with the original table.

This time, we want to find the percentage of each color based on the kind of surfboard. In other words, what percentage of longboards are blue or white, and what percentage of shortboards are blue or white? Let’s do the calculations for longboards:
Blue: ???20/(20+15)=20/35\approx0.57\approx57\%???
White: ???15/(20+15)=15/35\approx0.43\approx43\%???
Now we’ll do the calculations for shortboards:
Blue: ???5/(5+3)=5/8\approx0.63\approx63\%???
White: ???3/(5+3)=3/8\approx0.37\approx37\%???
Now we can turn the table into a row-relative frequency table.
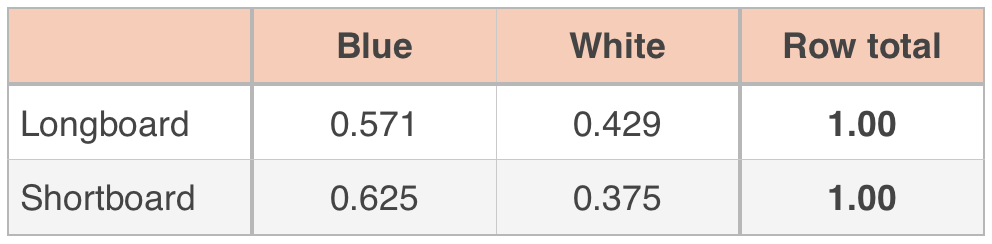
Out of all the longboard surfboards, ???57\%??? of them are blue and ???43\%??? of them are white. And out of all the shortboard surfboards, about ???63\%??? are blue and about ???37\%??? are white.
Total relative frequency
You can also calculate the total-relative frequency for a two-way table by dividing everything by the grand total.
Since there are ???43??? total surfboards, we divide each value in the body of the table and each value in the total column and row by ???43???. Then we can express the values as decimals
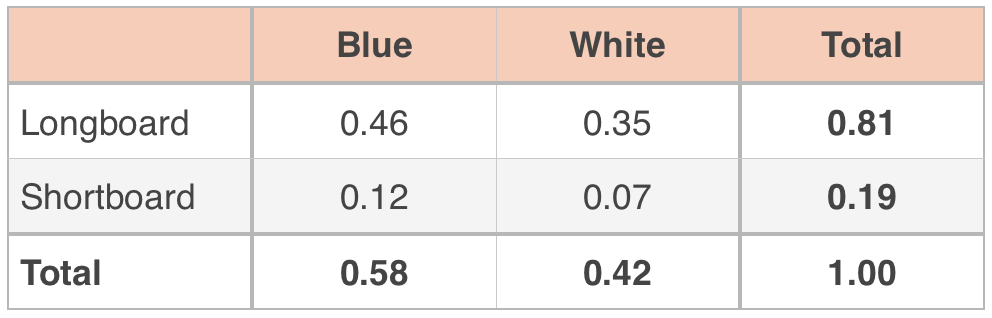
or as percentages.


