How to sketch polar curves

Identifying different forms of polar curves
We’ll sketch polar curves by plotting values for ???r??? at known values of ???\theta???. We can also use the table below to quickly graph polar curves given in these standard forms.

Hi! I'm krista.
I create online courses to help you rock your math class. Read more.
If we can’t use the table above to find a standard form for the polar curve we’re given, then we can always generate a table of coordinate points ???(r,\theta)???. In order to do that, we’ll take the value inside the trigonometric function that includes ???\theta???, set it equal to ???\pi/2???, then solve for ???\theta???. For example, given the polar curve ???r=6\sin{3\theta}???,
???3\theta=\frac{\pi}{2}???
???\theta=\frac{\pi}{6}???
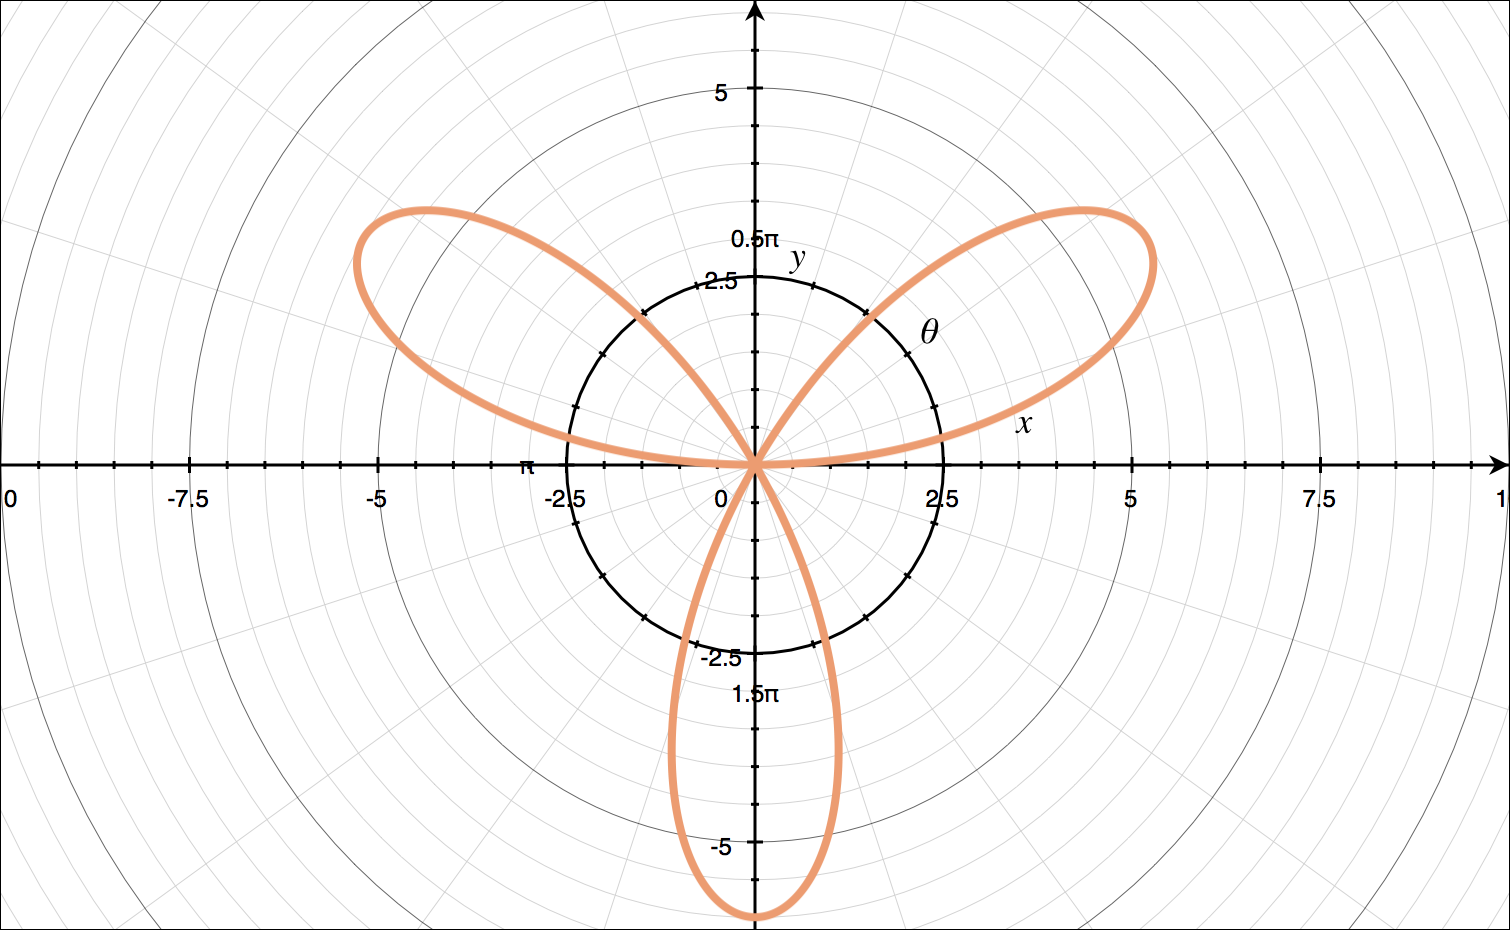
Then we’ll find ???r??? for the increments of ???\pi/6??? on the interval ???0\leq\theta\leq 2\pi???.
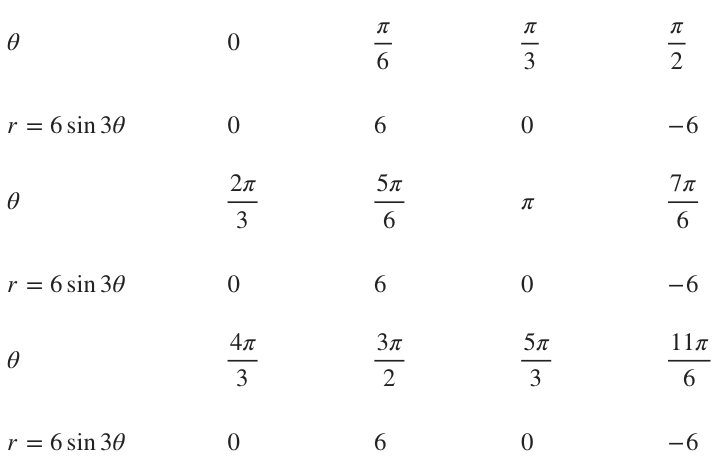
Plotting these points on polar axes, we get
Step-by-step example of how to sketch a polar curve


Take the course
Want to learn more about Calculus 2? I have a step-by-step course for that. :)
Graphing lines in polar coordinates
Example
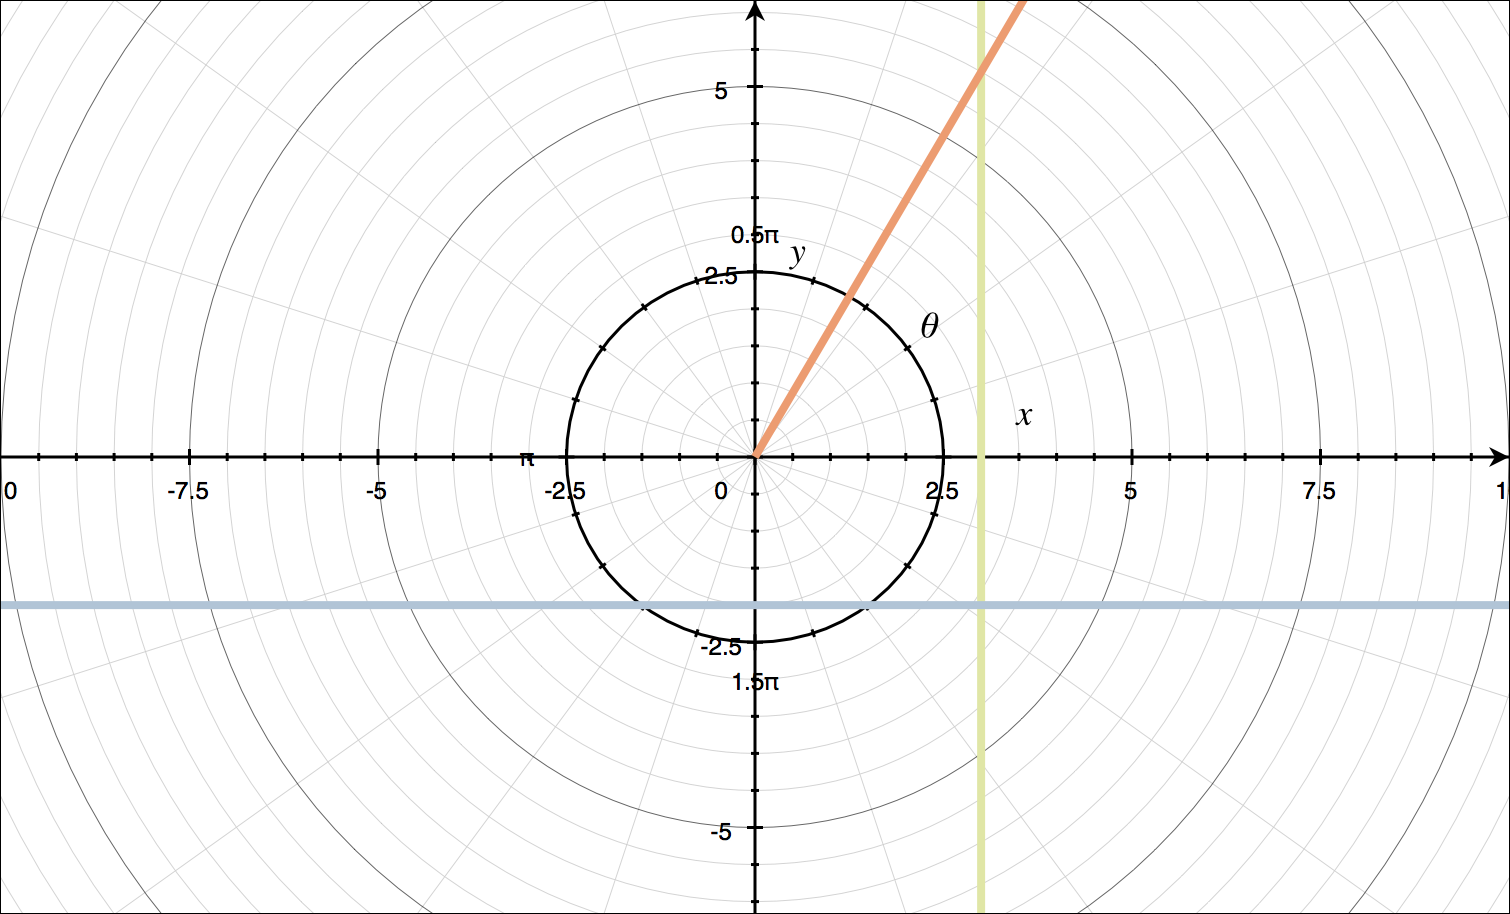
Graph the polar curves on the same axes.
???\theta=\frac{\pi}{3}???
???r\cos{\theta}=3???
???r\sin{\theta}=-2???
Using the table of standard curves, we can plot all of these on the same axes.
???\theta=\pi/3??? is like ???\theta=\beta???, so it’s a straight line through the origin at the angle ???\pi/3???.
???r\cos{\theta}=3??? is like ???r\cos{\theta}=a???, so it’s a vertical line through ???x=3???.
???r\sin{\theta}=-2??? is like ???r\sin{\theta}=b???, so it’s a horizontal line through ???y=-2???.
Let’s try some examples with circles defined in terms of polar coordinates.

To plot a polar curve, find points at increments of theta, then plot them on polar axes.
Graphing curves on the same set of axes
Example
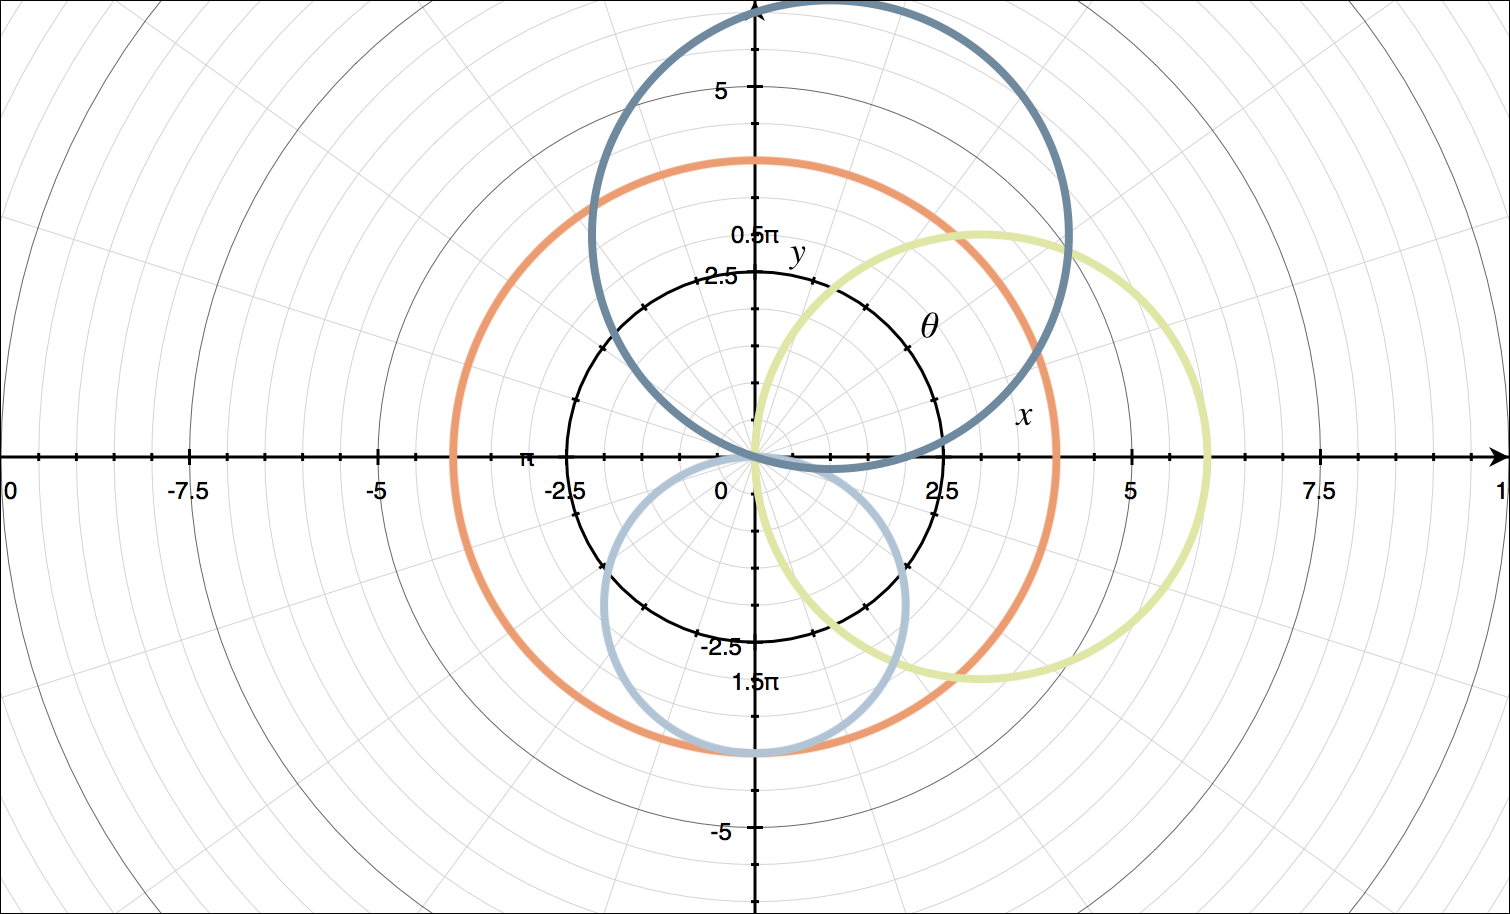
Graph the polar curves on the same axes.
???r=4???
???r=6\cos{\theta}???
???r=-4\sin{\theta}???
???r=2\cos{\theta}+6\sin{\theta}???
Using the table of standard curves, we can plot all of these on the same axes.
???r=4??? is like ???r=a???, so it’s a circle centered at ???(0,0)??? with radius ???4???.
???r=6\cos{\theta}??? is like ???r=2a\cos{\theta}???, so it’s a circle centered at ???(3,0)??? with radius ???|3|???.
???r=-4\sin{\theta}??? is like ???r=2b\sin{\theta}???, so it’s a circle centered at ???(0,-2)??? with radius ???|-2|???.
???r=2\cos{\theta}+6\sin{\theta}??? is like ???r=2a\cos{\theta}+2b\sin{\theta}???, so it’s a circle centered at ???(1,3)??? with radius ???\sqrt{a^2+b^2}=\sqrt{10}???.
Graphing cardioids, limacons, and roses
Example
Graph the polar curves.
???r=3+3\sin{\theta}???
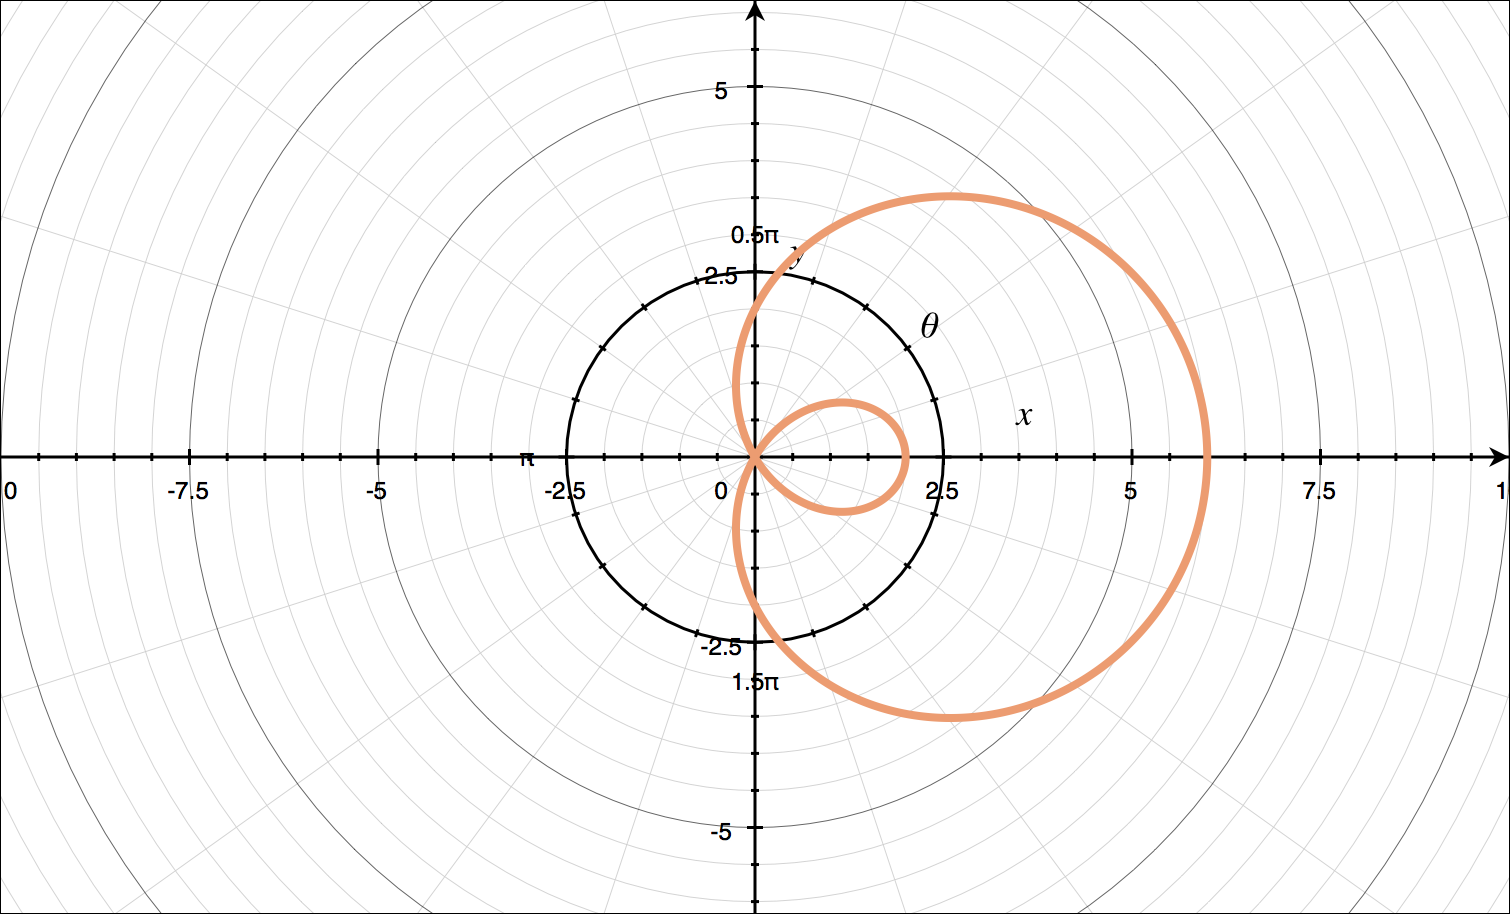
???r=2+4\cos{\theta}???
???r=7+6\cos{\theta}???
???r=6\sin{2\theta}???
For ???r=3+3\sin{\theta}???:
???r=3+3\sin{\theta}??? is like ???r=a\pm{a}\sin{\theta}???, so it’s a cardioid through the origin. We’ll generate a table of values over the interval ???0\le\theta\le2\pi???.

With these points and knowing the shape of our polar curve, we can sketch the graph.
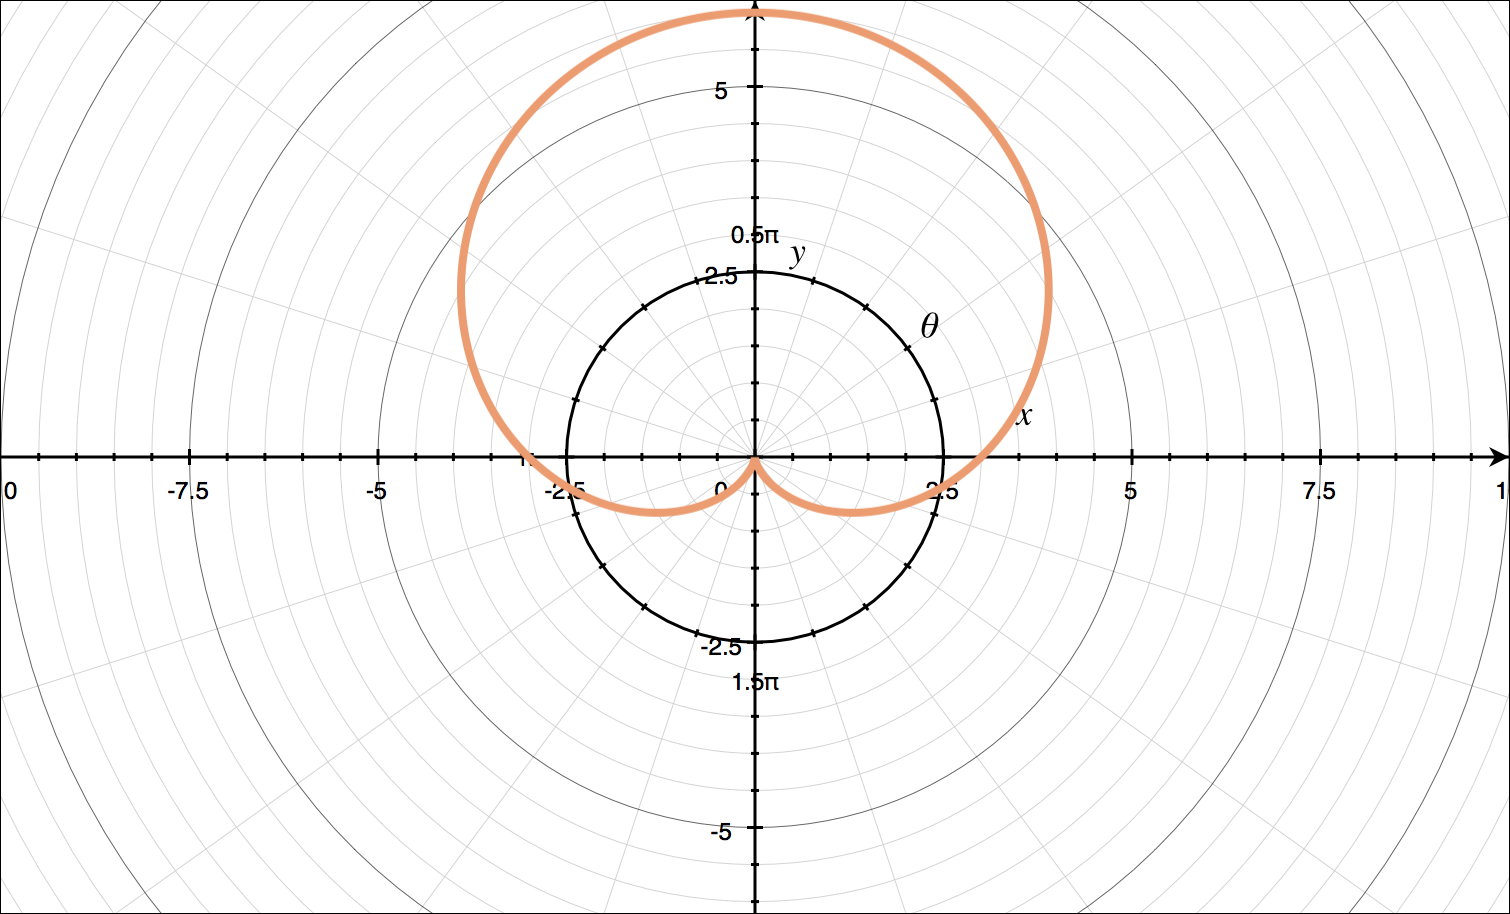
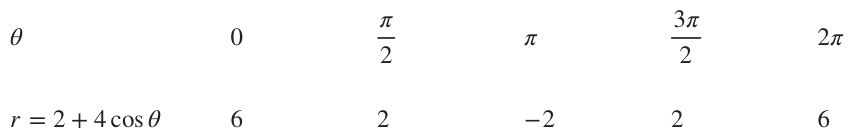
For ???r=2+4\cos{\theta}???:
???r=2+4\cos{\theta}??? is like ???r=a\pm{b}\cos{\theta}??? with ???a<b???, so it’s a limaçon with an inner loop. We’ll generate a table of values over the interval ???0\le\theta\le2\pi???.
With these points and knowing the shape of our polar curve, we can sketch the graph.
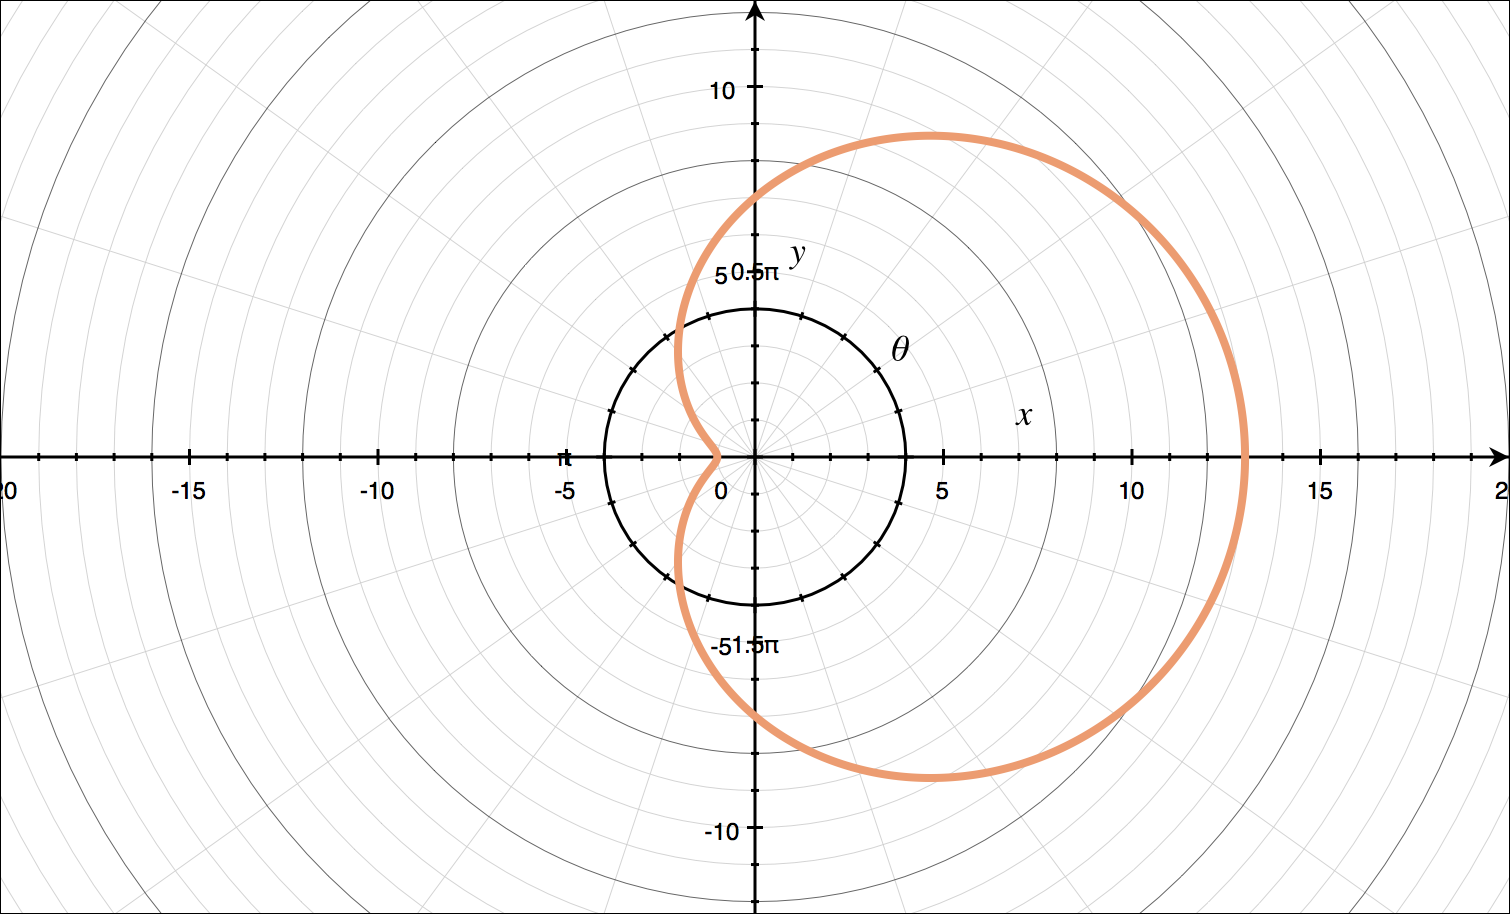
For ???r=7+6\cos{\theta}???:
???r=7+6\cos{\theta}??? is like ???r=a\pm{b}\cos{\theta}??? with ???a>b???, so it’s a limaçon without an inner loop. We’ll generate a table of values over the interval ???0\le\theta\le2\pi???.
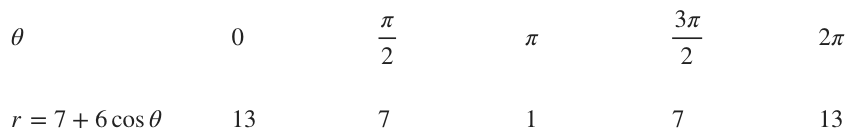
With these points and knowing the shape of our polar curve we can sketch the graph.
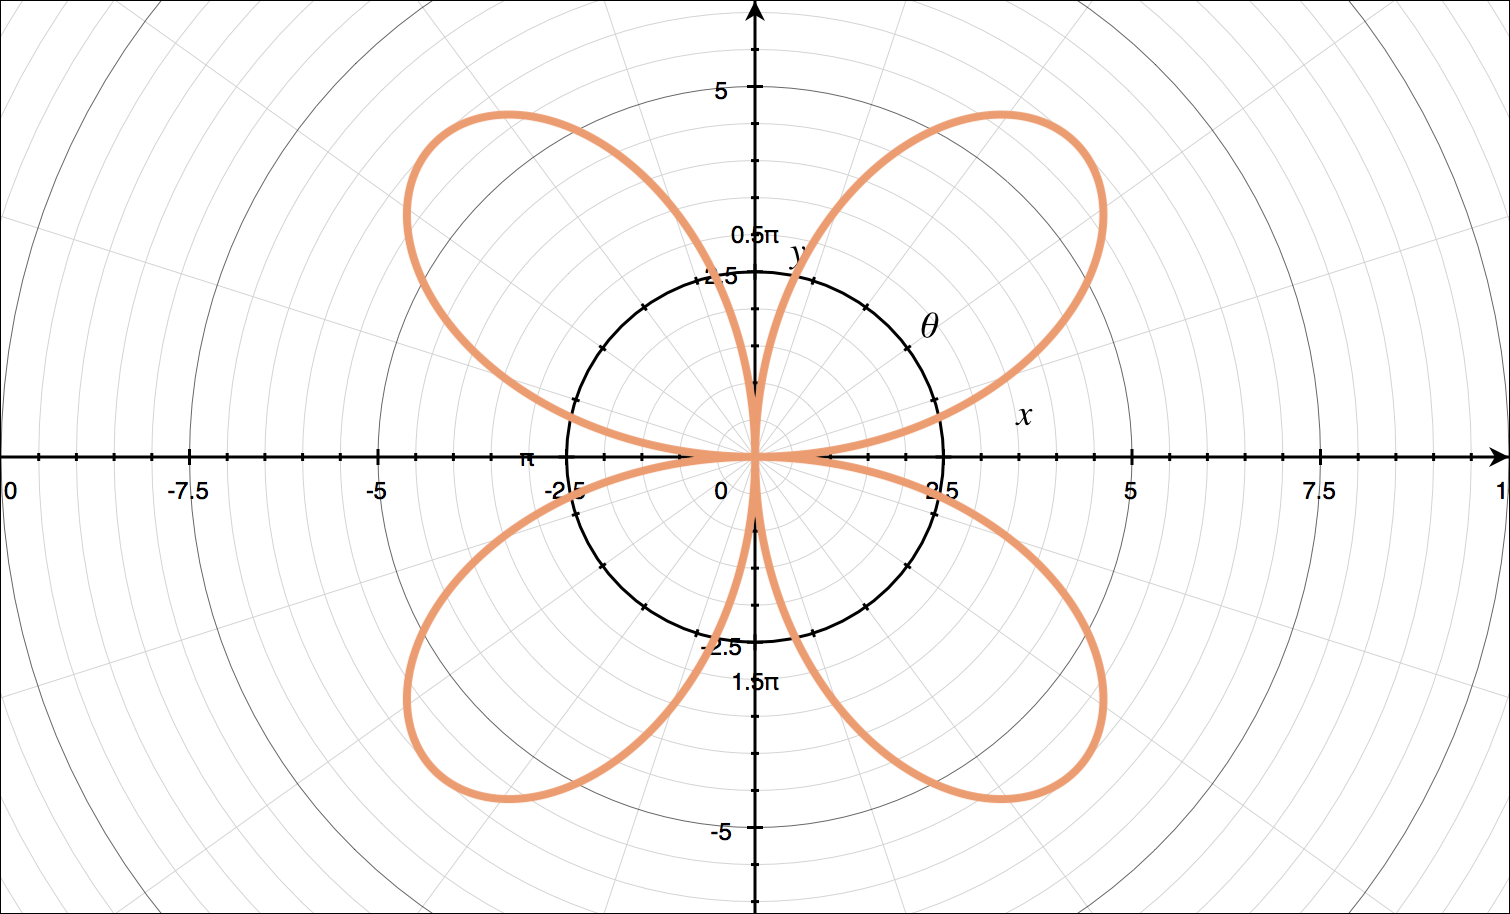
For ???r=6\sin{2\theta}???:
???r=6\sin{2\theta}??? doesn’t match any of the standard forms in our table. In this case, we’ll set the value inside our trigonometric function equal to ???\pi/2??? and then solve for ???\theta???.
???2\theta=\frac{\pi}{2}???
???\theta=\frac{\pi}{4}???
Then we’ll find ???r??? for the increments of ???\pi/4??? on the interval ???0\leq\theta\leq 2\pi???.
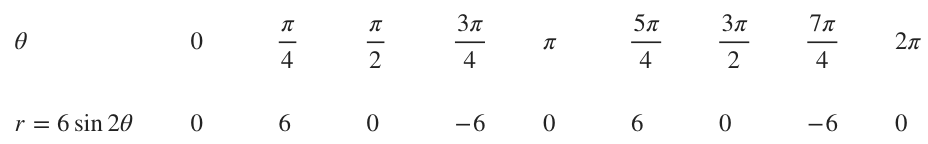
Plotting these points on polar axes, we get