
Measures of spread: range and IQR of the data set

What are the different ways that we measure spread in a data set?
We looked at measures of central tendency, which we saw were various ways of representing the “middle” of a data set. But central tendency isn’t the only thing we’re interested in when it comes to data.
We also want to know about spread, which is how, and by how much, our data set is spread out around its center. We also call measures of spread measures of dispersion, or scatter.

Hi! I'm krista.
I create online courses to help you rock your math class. Read more.
Range, interquartile range (IQR), variance, and standard deviation are all measures of spread.
Range
The range of a data set is the difference between the largest value and smallest value. For example, in this stem-and-leaf plot of golf scores,

the lowest score is ???66??? and the highest score is ???75???. Therefore the range of this data set is
???75-66=9???
Interquartile range (IQR)
You know how when you divide something into four parts, you cut it in half and then cut each half in half again? Each of those pieces is then a quarter of the original whole.
In a similar way, you can divide a data set into quarters by using the medians in the data. You cut the data in half at the median, and then find the median of each half, splitting the data at those points. Each quarter of the data that you’ve created is called a quartile.
The interquartile range is the difference between the median of the upper half and the median of the lower half. Let's see how it's done.
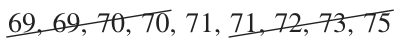
If we list out all of our golf scores from the stem chart, the data set is
???66,\ 67,\ 67,\ 68,\ 68,\ 68,\ 68,\ 69,\ 69,\ 69,\ 69,\ 70,\ 70,\ 71,\ 71,\ 72,\ 73,\ 75???
The median is ???(69+69)/2=69???.

To find the IQR, we’ll now split the data in half. Since this data set has ???18??? data points, we’ll have ???9??? data points in the lower half, and ???9??? data points in the upper half. We then need to find the median of each half.
The median of the lower half is ???68???.
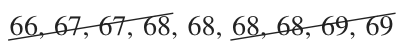
The median of the upper half is ???71???.
To see this visually, let’s look at the numbers we picked out from the original data set.
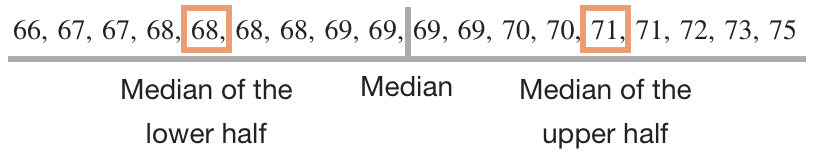
Now that we have the median of both halves of the data, we can find the interquartile range by taking the difference of those medians. For this data set, the IQR is ???71-68=3???.
Notice that in this data set of golf scores we had an even number of data points, and we therefore just divided the number of data points in two to get ???9??? data points in the lower half and ???9??? data points in the upper half.
We also need to know how to calculate the IQR when we have an odd number of data points. This data set has ???11??? data points:
???66,\ 67,\ 68,\ 69,\ 69,\ 69,\ 70,\ 71,\ 71,\ 72,\ 75???
If we find the median, we can see that it’s ???69???.
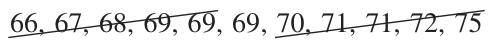
To separate the data into two halves with an equal number of data points in each, we’ll take the lower half as everything below the median (not including the median), and the upper half as everything above the median (not including the median). So the lower half will be ???66,\ 67,\ 68,\ 69,\ 69???, and its median is ???68???. The upper half will be ???70,\ 71,\ 71,\ 72,\ 75??? and its median is ???71???. The IQR of this data set with an odd number of data points is therefore ???71-68=3???.
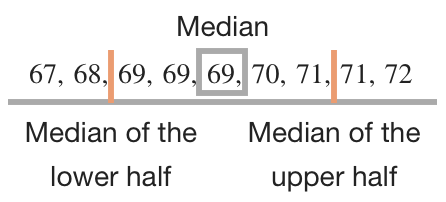
You can also have a data set with an odd number of data points where the median is the middle number, but then the upper and lower half of the data includes an even number of data points, so the median of each half will be the mean of two numbers. If we take away the first and last data point from the data set above, then the new data set is
???67,\ 68,\ 69,\ 69,\ 69,\ 70,\ 71,\ 71,\ 72???
The median of this set is ???69???.

But then the lower half of the data set is ???67,\ 68,\ 69,\ 69??? and the upper half of the data set is ???70,\ 71,\ 71,\ 72???. To find the median of these halves, we use the same process we always use to find the median of a data set with an even number of data points. We find the middle two numbers, and then take their mean. The median of the lower half, ???67,\ 68,\ 69,\ 69???, is ???(68+69)/2=68.5???. The median of the upper half, ???70,\ 71,\ 71,\ 72???, is ???(71+71)/2=71???.
Therefore, the IQR of this data set is ???71-68.5=2.5???.


