
Symmetric and skewed distributions and outliers

What are symmetric and skewed distributions?
A density curve is technically the smooth line that encloses a distribution. We call it a distribution because the area under the curve shows us the distribution of our data.

Hi! I'm krista.
I create online courses to help you rock your math class. Read more.
For example, in the distribution we drew for the ages of San Francisco residents,

we were able to see roughly how much of the population was age ???70??? or older, and we could similarly estimate how much of the population was between age ???30??? and age ???59???. The ages of all of the people in the population are “distributed” between age ???0??? and ???109???.
Symmetric distributions
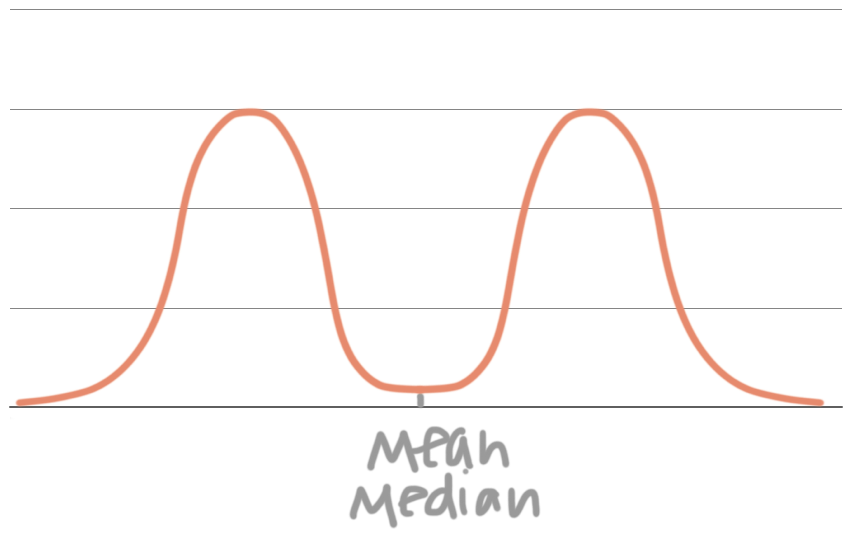
When a density curve is perfectly symmetric, then the mean and the median are both at the very center of the distribution. The mean and median for a symmetric distribution will always be wherever there’s an equal amount of area on the left and right. This is one example of a symmetric, non-normal distribution:
Symmetric distributions can be any shape (as long as they’re symmetric, of course), but we’ll deal a lot with what we call a normal distribution, which is a symmetric, bell-shaped distribution:

Skewed distributions
Skewed distributions are non-symmetric distributions that lean right or left. We’ll look at negatively skewed distributions (also called left-skewed distributions or left-tailed distributions), and positively skewed distributions (also called right-skewed distributions or right-tailed distributions).
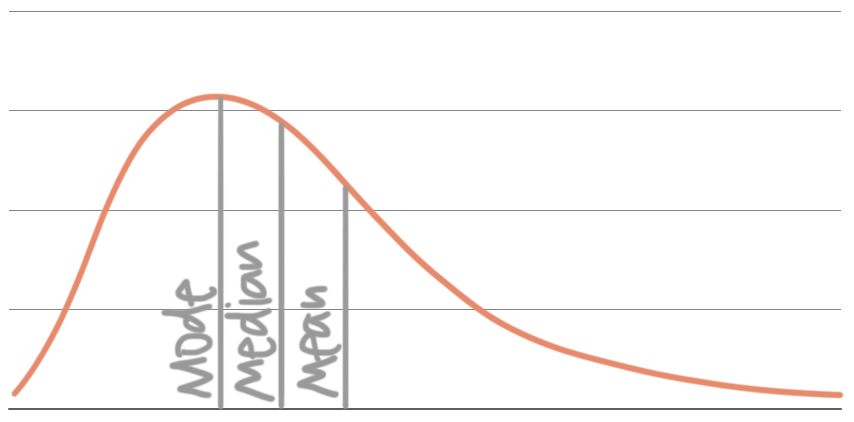
In a left-skewed distribution, the “tail” is on the left. The median of a left-skewed distribution is still at the point that divides the area into two equal parts. The mean is further to the left than the median, more towards the tail on the left side, and the mode is where the data peaks:
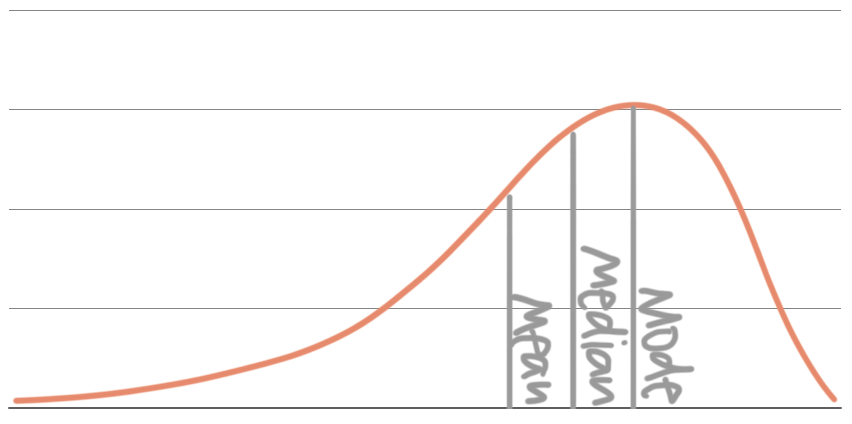
In a right-skewed distribution, the “tail” is on the right. The median of a right-skewed distribution is still at the point that divides the area into two equal parts. The mean is further to the right than the median, more towards the tail on the right side, and the mode is still where the data peaks:
Outliers
The reason we get skewed distributions is because data is disproportionally distributed. Specifically, the majority of the data is clustered in one area, and there are one or more outliers away from the majority of the data. Outliers are data points that are unlike most of the rest of the data.
Oftentimes we can’t just “eyeball” an outlier. If there’s a data point that’s really far from most of the data, then we can probably call it an outlier. But there’s also a technical way to calculate outliers.
We use what’s called the 1.5-IQR rule, and it will identify both high outliers (outliers above the majority of the data) and low outliers (outliers below the majority of the data). The rule says that a low outlier is anything less than ???Q1??? (the first quartile) minus 1.5(IQR), and that a high outlier is anything greater than ???Q3??? (the third quartile) plus 1.5(IQR).
Low outliers: ???Q_1-1.5(\text{IQR})???
High outliers: ???Q_3+1.5(\text{IQR})???
For example, if ???Q_1=25???, ???Q_3=35???, and therefore ???\text{IQR}=10???, then the low outliers would be the data points below ???25-1.5(10)=10??? and the high outliers would be the data points above ???35+1.5(10)=50???.
When we have a data set with outliers that skew the data, the median will be a better measure of central tendency than the mean, and the interquartile range will be a better measure of spread than standard deviation. That’s because mean and standard deviation will take into account all points in the data set, including the outliers. But median and IQR can ignore these outliers, giving us more accurate measurements of the data.
So if our data is skewed or if there are outliers, use median for central tendency and IQR for spread. But if our data is fairly symmetrical or there aren’t outliers, then consider using mean and standard deviation for central tendency and spread, respectively.
Describing distributions
When we want to describe the general shape of a distribution, we should mention what we know about its shape, center, spread, and outliers.
Let’s take a look at this dot plot of golf scores.
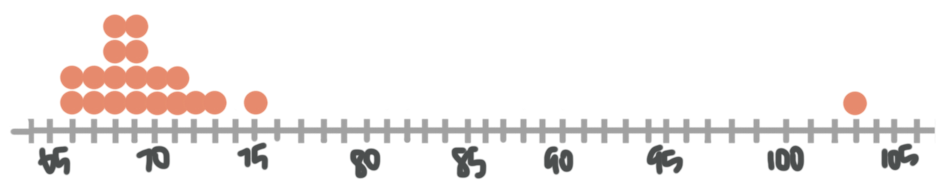
If we imagine drawing a smooth curve over this data, including the point all the way out at ???103???, we would have a skewed distribution where the long thin tail is on the right side, which means this is a right-skewed, or right-tailed distribution.
The range of the data is ???103-66=37???, and there is one outlier: ???103???. We can tell just by looking at the dot plot that the median is probably close to about ???69???, but since we have all of the actual data points, we could also calculate it precisely to see that it is in fact ???69???. We could also find the IQR to be ???71-68=3???.
Remember that, because we have a skewed distribution, the median will be a better measure of center than the mean, and IQR will be a better measure of spread than standard deviation. If we calculate the mean, we find that it’s just about ???71???.
Let’s summarize what we found about this distribution of golf scores:
Shape: Positively (right) skewed
Center: Median of ???69??? (more accurate); Mean of ???71??? (less accurate)
Spread: IQR of ???3???
Outliers: ???103???


