
Type I and II errors and significance level
Type I and Type II risk in sampling
Whenever we’re using hypothesis testing, we always run the risk that the sample we chose isn’t representative of the population. Even if the sample was random, it might not be representative.
For instance, if I’ve been told that ???15\%??? of American females have blue eyes, and I’ve set up null and alternative hypotheses to test this claim,
???H_0???: ???15\%??? of American females have blue eyes
???H_a???: the percentage of American females with blue eyes is not ???15\%???
then when I take a sample and investigate it, I still run two types of risks.

Hi! I'm krista.
I create online courses to help you rock your math class. Read more.
Type I and Type II errors
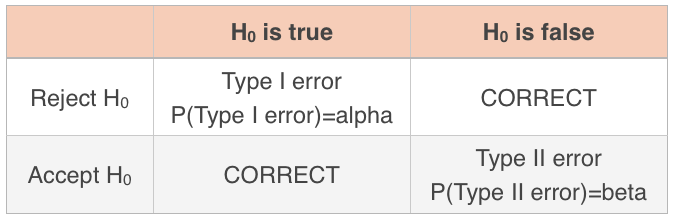
First, let’s assume that the null hypothesis is true and that the percentage of American females with blue eyes is ???15\%???. I might pull a sample of ???100??? women, find that ???40??? of them have blue eyes, and get a sample mean of ???\mu_{\bar x}=40\%???. If I use my sample data to reject the null hypothesis, but the null hypothesis was actually true, I’ve just made a Type I error. The probability of making a Type I error is alpha, ???\alpha???, also called the level of significance.
Second, let’s assume that the null hypothesis is false, (which is the same as saying that the alternative hypothesis is true), and that the percentage of American females with blue eyes is in fact not ???15\%???. Let’s say I pull the same sample of ???100??? women and get a sample mean of ???\mu_{\bar x}=15\%???. If I use my sample data to accept the null hypothesis, even though I should have rejected it because it’s actually false, then I’ve just made a Type II error. The probability of making a Type II error is beta, ???\beta???.
There are lots of other ways to describe Type I and Type II errors, including
Type I error: Supporting the alternative hypothesis when the null hypothesis is true.
Type II error: Not supporting the alternative hypothesis when the null hypothesis is false.
Thinking about Type I and Type II errors can get people a little twisted around sometimes, so if you find that there’s one description of them that makes more sense to you than the others, stick with that one.
Because ???\alpha??? is literally the probability of making a Type I error, and ???\beta??? is literally the probability of making a Type II error, we can say that the alpha level is
the probability of making the wrong decision when the null hypothesis is true, or
the probability of rejecting the null hypothesis when it’s true, or
the probability of making a Type I error
and the beta level is
the probability of making the wrong decision when the null hypothesis is false, or
the probability of accepting the null hypothesis when it’s false, or
the probability of making a Type II error
Detailed explanation of significance level and Type I and II risk


Take the course
Want to learn more about Probability & Statistics? I have a step-by-step course for that. :)
Making a Type I error or Type II error
Example
Lynnie is testing her hypothesis that people in her town spend more money on coffee on Monday morning than they do on Tuesday morning. She doesn’t know it, but her hypothesis is true: people actually do spend more money on coffee on Monday. She picks a random sample of people in her town and asks them how much money they spent on coffee each day. Say whether Lynnie will make a Type I or Type II error.

Lynnie’s null and alternative hypotheses are
???H_0???: People do not spend more on coffee on Monday than they do on Tuesday: ???C_M\leq C_T???
???H_a???: People spend more on coffee on Monday than they do on Tuesday: ???C_M>C_T???
In reality, her null hypothesis is true. But her sample data is showing that people spend more on Tuesday than they do on Monday. Which means she’s in danger of rejecting the null hypothesis when she shouldn’t since the null hypothesis is true.
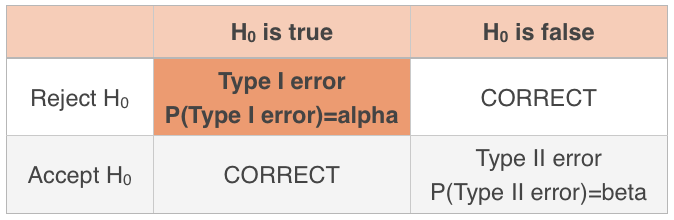
From the table, the intersection of “reject the null” and “the null is true” is a Type I error. Lynnie is in danger of committing a Type I error.

the Alpha level is the risk of committing a type I error
Power, confidence levels, and the alpha value
Power
Sometimes we say that the power is the probability our test will reject the null hypothesis when it’s false, which is a correct decision. Rejecting the null hypothesis when it’s false is exactly what were hoping to do.
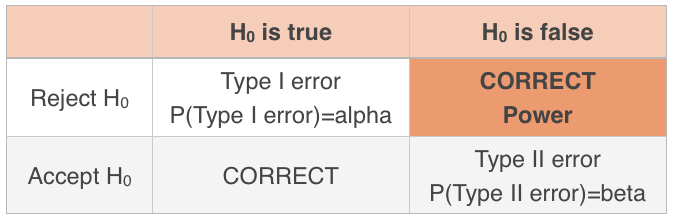
So the higher the power, the better off we are. Power is also equal to ???1-\beta???.
Confidence levels and the ???\alpha??? value
This ???\alpha??? value, called the level of significance, is the same ???\alpha??? value we talked about when we looked at confidence levels and confidence intervals.
Remember that we usually pick a confidence level of ???90\%???, ???95\%???, or ???99\%???, and these correspond to ???\alpha??? values of
At ???90\%??? confidence, the alpha value is ???\alpha=1-90\%=10\%???
At ???95\%??? confidence, the alpha value is ???\alpha=1-95\%=5\%???
At ???99\%??? confidence, the alpha value is ???\alpha=1-99\%=1\%???
So you could also say that we normally pick an ???\alpha??? value of ???10\%???, ???5\%???, or ???1\%???. When you decide on ???\alpha???, you’re actually deciding how much you want to risk committing a Type I error. In other words, if you choose ???\alpha=0.05???, you’re saying that, ???5\%??? of the time, or ???1??? out of ???20??? times, you’ll reject the null hypothesis when the null hypothesis is actually true.
Choosing a significance level of ???1\%??? means you want to be more confident about the result than if you’d picked ???\alpha=10\%???. While it’s true that you always want to be as confident as possible about your result, remember that picking a higher confidence level (and therefore lower alpha value) comes at a cost. The lower the alpha value, the wider the confidence interval and the larger the margin of error.
Similarly, since ???\alpha??? is the probability of making a Type I error, and ???\beta??? is the probability of making a Type II error, you’d obviously like to minimize ???\alpha??? and ???\beta??? as much as possible, because of course we always want to minimize the possibility that we’ll make an error.
But reducing the ???\alpha??? value increases the ???\beta??? value, and vice versa. The only way to reduce them both simultaneously is to increase the sample size. We can’t, but if we could increase the sample size until it’s as big as the population, the values of ???\alpha??? and ???\beta??? would be ???0???.
