
Box-and-whisker plots

Box-and-whisker plots are great at displaying the data’s median and spread
Box-and-whisker plots (also called box plots) are a great way to represent a data set when we want to show the median and spread of the data at the same time.

Hi! I'm krista.
I create online courses to help you rock your math class. Read more.
In general, a box-and-whisker plot might look like this:
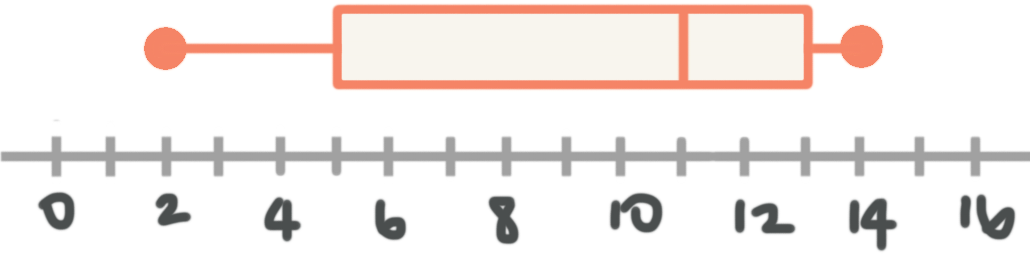
The big rectangle in the center is the box, and the little lines extending out from the sides are the whiskers.
The great thing about a box plot is that we know the median, range, upper and lower bounds just by looking at it. The interquartile range is also just a simple calculation.
The vertical line inside the box is the median of the data set, so the median of the data set represented in the plot above is ???11???.
The dot at the end of the left whisker is the minimum of the data set, and the dot at the end of the right whisker is the maximum of the data set. So in this plot, we can say that the minimum is ???2???, that the maximum is ???14???, and so we know right away that the range of the data is ???14-2=12???.
The IQR is given by the ends of the box. Since the box above extends from ???5??? to ???13???, the IQR is ???13-5=8???.
The box-and-whisker plot also shows us where each quartile of the data is located. A quartile is a number that divides the data set into quarters. The first quartile, ???Q1???, separates the lowest ???25\%??? of data points from the second ???25\%???. The second quartile, ???Q2???, is the median, and it separates the data set into halves. The third quartile, ???Q_3???, separates the third ???25\%??? of data points from the upper ???25%??? of data points.

In a box-and-whisker plot, the left end of the box represents ???Q1???, the median represents ???Q2???, and the right end of the box represents ???Q_3???. Based on the box plot above,
???25\%??? of the data points lie between ???2??? and ???5???
???25\%??? of the data points lie between ???5??? and ???11???
???25\%??? of the data points lie between ???11??? and ???13???
???25\%??? of the data points lie between ???13??? and ???14???
Therefore,
???5??? is the first quartile
???11??? is the second quartile
???13??? is the third quartile
In a box-and-whisker plot, the middle ???50\%??? of the data is represented inside the box, the lowest ???25\%??? in the whisker on the left, and the highest ???25\%??? in the whisker on the right.
As far as our quarters, this means that the first quarter is represented by the whisker on the left, the second quarter is represented by the part of the box to the left of the median, the third quarter is represented by the part of the box to the right of the median, and the fourth quarter is represented by the whisker on the right.
Five-number summary
The five-number summary, also called the five-figure summary, for any set of data will include the minimum and maximum values, the median, and ???Q1??? and ???Q3??? for the data set. We usually give the five-number summary in a table, and we can easily gather all of this information from a box-plot.
The five-number summary for the box plot
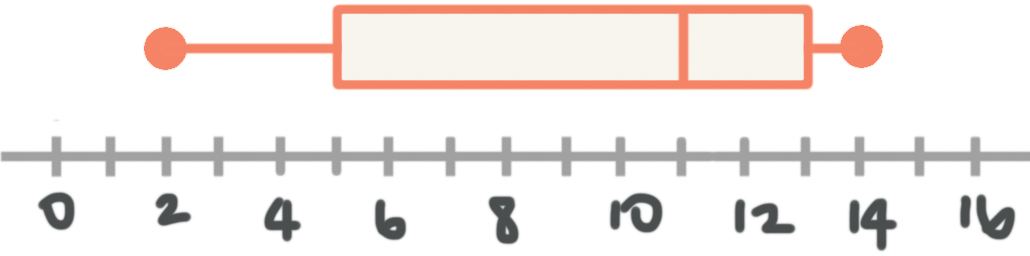
is


