
Critical points and the first derivative test

What are critical points, and how do we find them?
The optimization process is all about finding a function’s least and greatest values. If we use a calculator to sketch the graph of a function, we can usually spot the least and greatest values.

Hi! I'm krista.
I create online courses to help you rock your math class. Read more.
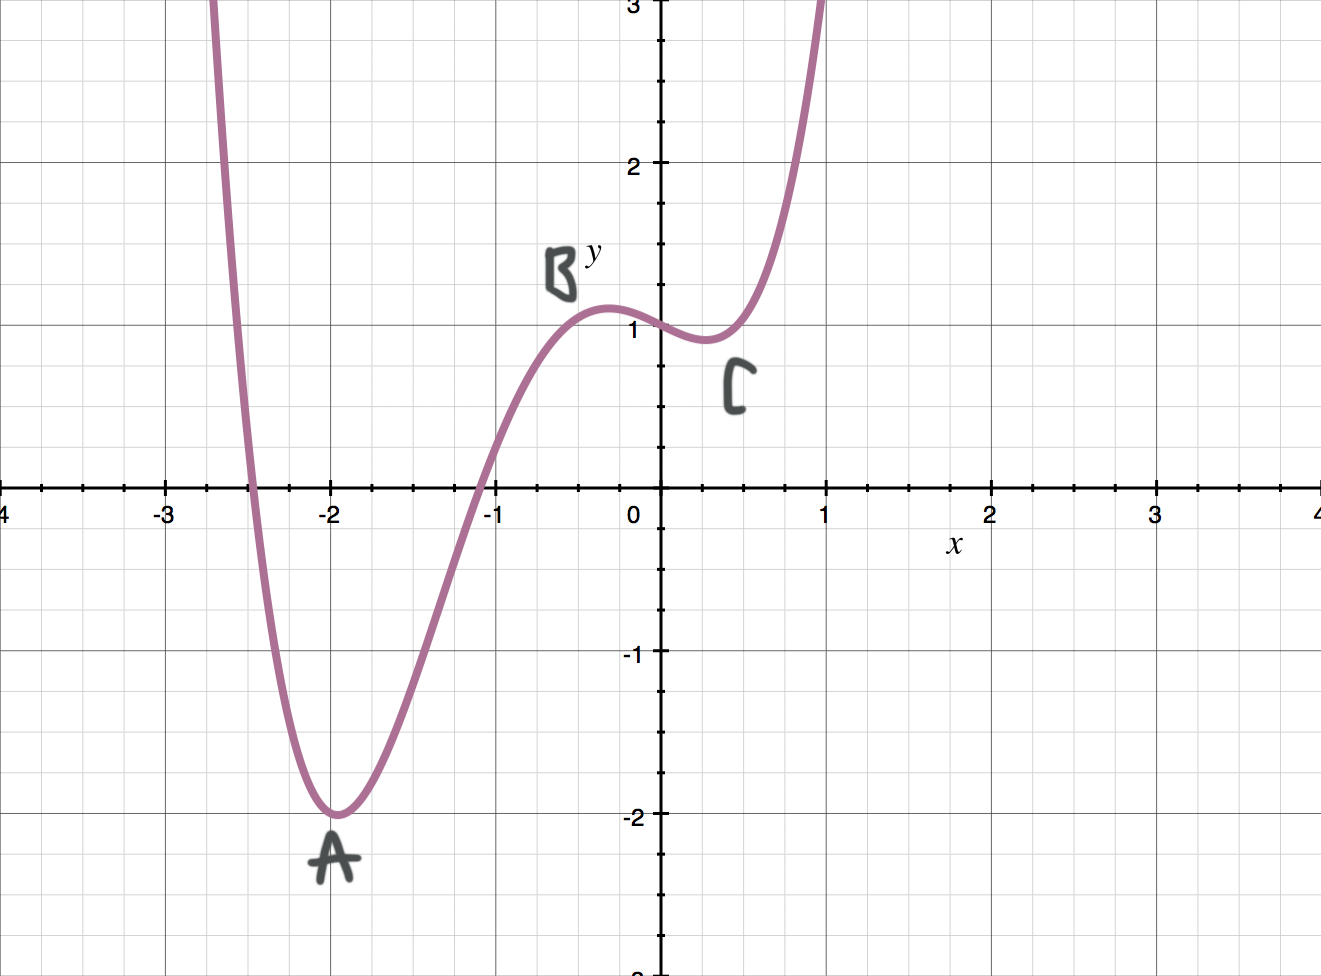
For example, for the function sketched out below, we can see just by looking at the graph that the function reaches its lowest value at ???A???. This lowest possible point is the function’s global minimum.
There’s a reason why it’s important that we be able to find this global minimum. Let’s pretend for a moment that the function shown in the graph actually models the likelihood that food will spoil in a restaurant freezer at varying temperatures.
If I’m the business owner of this restaurant, and I want to minimize the likelihood that my food will spoil, then I’m very interested in finding this global minimum. If I know how to do the math to calculate this value, then I’ll know the exact temperature at which I should set the freezer, in order to minimize the chance that my food will spoil.
And that’s really valuable! Getting this right can save me time and money, and help make sure that my restaurant runs smoothly and is successful in the long term.
That’s what optimization is all about. It let’s us calculate the point at which a function is maximized or minimized, and that has all kinds of real-world applications, which we’ll talk about in depth later in the course.
In this section, we’re going to talk all about the optimization process, starting with how to find a function’s least and greatest values. We’ll finish the section by translating these optimization steps into learning how to sketch the function’s graph.
Local and global extrema
In general, a function’s least and greatest values are its extrema. Think about the extrema as being the function’s “extreme points.”
The function’s extrema are made up of its least points, which we call the minima, and its greatest points, which we call the maxima.
Within the function’s minima, we distinguish between local (relative) minima and global (absolute) minima. And within the function’s maxima, we distinguish between local (relative) maxima and global (relative) maxima.
As an example, let’s look again at the same graph as before.

We already said that the function’s absolute/global minimum is at ???A???, and that’s because ???A??? is the point where the function has the lowest value over its entire domain. But the function also has a local minimum at ???C???, because ???C??? is the function’s lowest point in the area near ???C???.
The function also has a local maximum at ???B???, because ???B??? is the function’s highest point in the area near ???B???.
We wouldn’t define an absolute maximum for the function, because it shoots up toward ???\infty??? both to the left of ???A??? and to the right of ???C???, so there’s no finite point we could name that would describe the highest value that the function ever reaches.
So, in general,
A local/relative maximum exists wherever the function changes direction from increasing to decreasing. If a local maximum also happens to be the function’s highest point anywhere in its domain, then it’s also the global/absolute maximum. A function can have infinitely many local/relative maxima, but it’ll only one (or no) global/absolute maximum.
A local/relative minimum exists wherever the function changes direction from decreasing to increasing. If a local minimum also happens to be the function’s lowest point anywhere in its domain, then it’s also the global/absolute minimum. A function can have infinitely many local/relative minima, but it’ll only one (or no) global/absolute minimum.
Keep in mind that not all of these extrema will exist for every function. In the graph we looked at before, the function has
a local minimum at ???A??? and a local minimum at ???C???
a local maximum at ???B???
a global minimum at ???A???
no finite global maximum
But you could imagine a different function, like ???y=x^2???, which is a parabola with its vertex at the origin that opens up. That parabola has only one local minimum at ???x=0???, that local minimum also happens to be the global minimum, but the parabola has no local maximum and no global maximum.
To take another example, the line ???y=x??? is the line that runs through the origin with slope ???m=1???, and it has no extrema at all (no local maxima or minima, and no global maximum or minimum) because it never changes direction.
So which extrema you’re able to classify will always depend on the particular function you’re working with.
Critical points
The first step in any optimization process is always to find the function’s critical points.
Critical points exist where the derivative is equal to ???0??? (or possibly where the derivative is undefined), and they represent points at which the graph of the function will change direction, either from decreasing to increasing, or from increasing to decreasing.
Because the function changes direction at critical points, the function will always have at least a local maximum or minimum at the critical point, if not a global maximum or minimum there.
To find critical points, we simply take the derivative, set it equal to ???0???, and then solve for the variable.
How to use critical points to find local and global extrema


Take the course
Want to learn more about Calculus 1? I have a step-by-step course for that. :)
Step-by-step example of finding critical points and applying the first derivative test
Example
Find the critical points of the function.
???f(x)=x+\frac{4}{x}???
Rewrite the function using negative exponent rules.
???f(x)=x+4x^{-1}???
Use power rule to take the derivative.
???f'(x)=1-4x^{-2}???
???f'(x)=1-\frac{4}{x^2}???
Set the derivative equal to ???0??? and solve for ???x???.
???1-\frac{4}{x^2}=0???
???1=\frac{4}{x^2}???
???x^2=4???
???x=\pm2???
These are the critical points of ???f(x)???.

Critical points exist where the derivative is 0, and represent points at which the graph of the function changes direction from decreasing to increasing, vice versa.
Increasing and decreasing
Because the critical points are the points at which the function changes direction, from increasing to decreasing or from decreasing to increasing, the next step is to investigate the behavior in between the critical points.
Where the derivative is positive, the function is increasing. A function is increasing when it moves up as we move from left to right.
Where the derivative is negative, the function is decreasing. A function is decreasing when it moves down as we move from left to right.
To test the sign of the derivative, we’ll simply pick a value between each pair of critical points, and plug that test value into the derivative to see whether we get a positive result or a negative result. If the test value gives a positive result, it means the function is increasing on that interval, and if the test value gives a negative result, it means the function is decreasing on that interval.
If we find one critical point for the function, then we just need to look at the derivative’s sign on the left side and right side of that one critical point.
But if we find multiple critical points, then we need to find the derivative’s sign to the left of the left-most critical point, to the right of the right-most critical point, and between each critical point.
Let’s continue with one of the previous examples, looking at the sign of the derivative between each critical point.
Example
The critical points of the function are ???x=\pm2???. Where is the function increasing and where is it decreasing?
???f(x)=x+\frac{4}{x}???
Previously, we used the derivative to find that the function had critical points at ???x=\pm2???. Once we have the critical points, it’s helpful to plot them along a number line from least to greatest, left to right.

From this diagram, we can see that we have to test three intervals.
???-\infty<x<-2???
???-2<x<2???
???2<x<\infty???
To test ???-\infty<x<-2???, we’ll plug a test value of ???x=-3??? into the derivative, since ???x=-3??? is a value in that interval. We could have picked any other value to use instead, as long as it fell in the interval ???-\infty<x<-2???.
???f'(x)=1-\frac{4}{x^2}???
???f'(-3)=1-\frac{4}{(-3)^2}???
???f'(-3)=1-\frac{4}{9}???
???f'(-3)=\frac{9}{9}-\frac{4}{9}???
???f'(-3)=\frac{5}{9}>0???
To test ???-2<x<2???, we’ll plug ???x=-1??? into the derivative. Even though we could have used ???x=0??? as a test value for this interval, it’s nice to avoid ???0??? as a test value, since not all function’s evaluate nicely at ???0???, this one included.
???f'(x)=1-\frac{4}{x^2}???
???f'(-1)=1-\frac{4}{(-1)^2}???
???f'(-1)=1-4???
???f'(-1)=-3<0???
To test ???2<x<\infty???, we’ll plug ???x=3??? into the derivative.
???f'(x)=1-\frac{4}{x^2}???
???f'(3)=1-\frac{4}{3^2}???
???f'(3)=1-\frac{4}{9}???
???f'(3)=\frac{9}{9}-\frac{4}{9}???
???f'(3)=\frac{5}{9}>0???
The derivative was positive on the first interval, negative on the second interval, and positive on the third interval. Plot these signs on the critical point diagram we drew earlier.
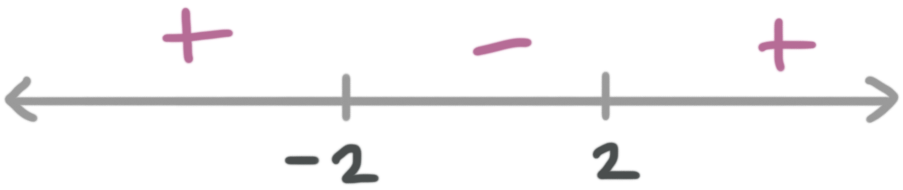
Remember that the original function ???f(x)??? is increasing where we found a positive result, and decreasing where we found a negative result. So we can say
???f(x)??? is increasing on ???-\infty<x<-2???
???f(x)??? is decreasing on ???-2<x<2???
???f(x)??? is increasing on ???2<x<\infty???
First derivative test
Once we’ve found the intervals on which the function is increasing and decreasing, we’ve really already completed the first derivative test, other than explicitly stating conclusions about the function’s maximum and minimum values.
Because the first derivative test is just the test for finding the function’s maxima and minima.
In other words, once we have the critical point diagram filled in with the signs of the derivative,

the first derivative test lets us state the following conclusions:
If the derivative is negative to the left of the critical point and positive to the right of it, the graph has a local minimum at that point (and it’s possible this local minimum might be a global minimum).
If the derivative is positive to the left of the critical point and negative to the right of it, the graph has a local maximum at that point (and it’s possible this local maximum might be a global maximum).
So for the previous example, the first derivative test allows us to conclude that the function has a local maximum at ???x=-2??? and a local minimum at ???x=2???.
