
Normal distributions, z-scores, and the empirical rule

The bell-shaped normal distribution and the empirical rule
In the last section, we talked about a normal distribution, which is a bell-shaped, symmetric curve for normally distributed data, that looks something like this:

Hi! I'm krista.
I create online courses to help you rock your math class. Read more.
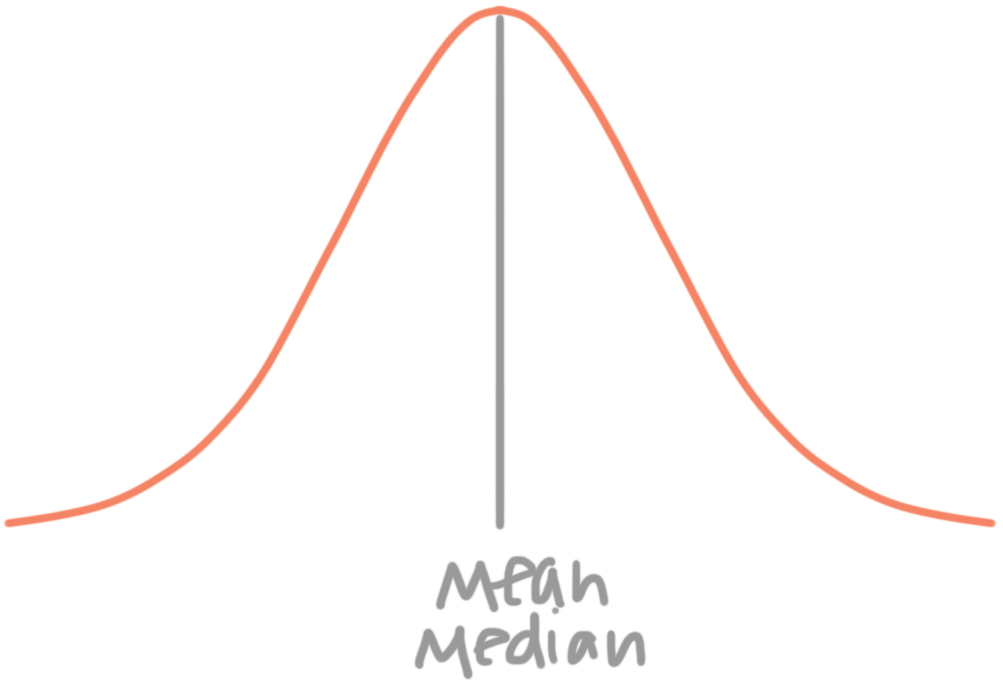
We’ll spend a lot of time working with distributions like this, so let’s talk about some of the most important properties of a normal distribution.
The empirical rule
Normal distributions follow the empirical rule, also called the 68-95-99.7 rule. The rule tells us that, for a normal distribution, there’s a
???68\%??? chance a data point falls within ???1??? standard deviation of the mean
???95\%??? chance a data point falls within ???2??? standard deviations of the mean
???99.7\%??? chance a data point falls within ???3??? standard deviations of the mean
In other words, if we want to show this graphically,
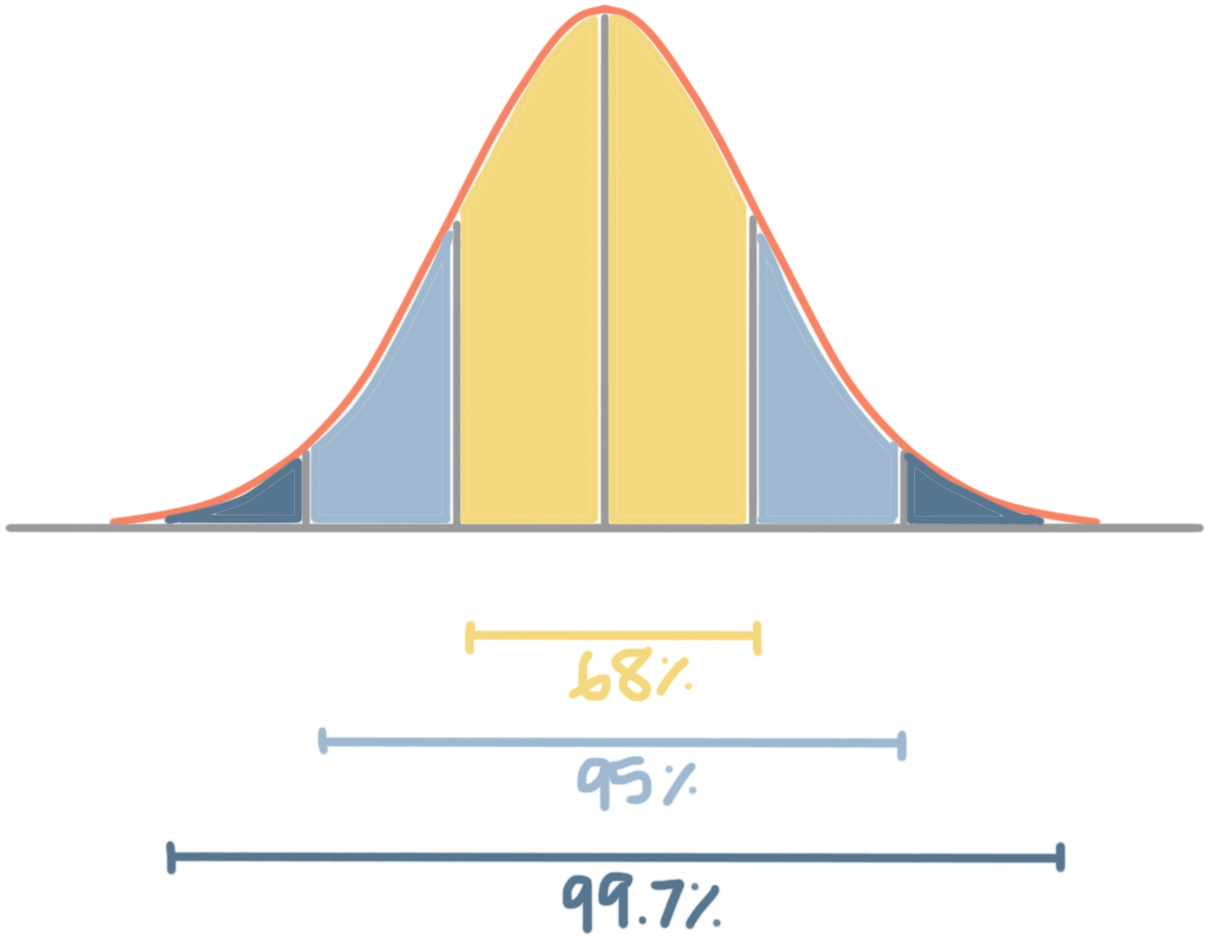
we can show that ???68\%??? of the data will fall within ???1??? standard deviation of the mean, that within ???2??? full standard deviations of the mean we’ll have ???95\%??? of the data, and that within ???3??? full standard deviations from the mean we’ll have ???97.7\%??? of the data.
And we can draw all kinds of conclusions based on this information, and the fact that the all the area under the graph represents ???100\%??? of the data. For example, since total area is ???100\%???, and the data within three standard deviations is ???99.7\%???, that means that we’ll always have ???0.3\%??? of the data in a normal distribution that lies outside three standard deviations from the mean. Or if we wanted to know how much of our data will lie between one and two standard deviations from the mean, we can say that it’s ???95\%-68\%=27\%???.
Percentile
We look a lot at percentiles within a normal distribution. The nth percentile is the value such that n percent of the values lie below it. In other words, a value in the 95th percentile is greater than ???95\%??? of the data. The 50th percentile in a normal distribution always gives the median, and the IQR is always found using the 75th percentile minus the 25th percentile.
Z-scores
A ???z???-score tells you the number of standard deviations a point is from the mean. To calculate a ???z???-score for normally distributed data (normal distributions) we use the
???z=\frac{x-\mu}{\sigma}???
where ???x??? is the data point, ???\mu??? is the mean, and ???\sigma??? is the standard deviation.
The ???z???-score for a data point is how far it is from the mean, and you always want to give the ???z???-score in terms of standard deviations. Therefore, to find the ???z???-score at a certain point in the distribution, we use the formula above, taking the data point, subtracting the mean, and then dividing that result by the standard deviation. That gives us a value for ???z???.
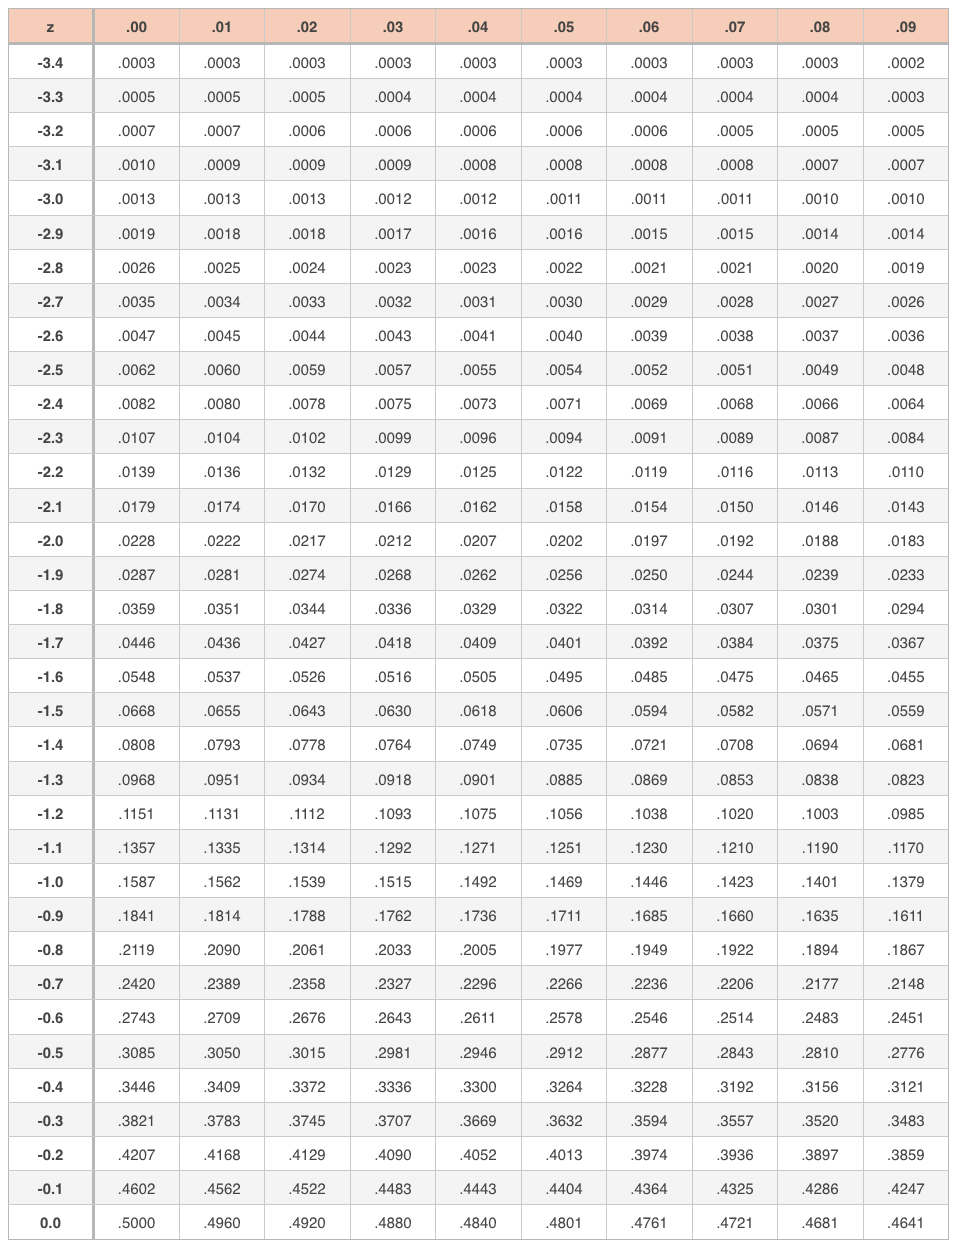
We’ll look up the ???z???-score in a ???z???-table, which is a table that takes the number of standard deviations and tells you the percentage of the area under the curve up to that point.
Data points that are less than the mean will be to the left of the mean and will have a negative ???z???-score. They should be looked up in the table of negative ???z???-scores:
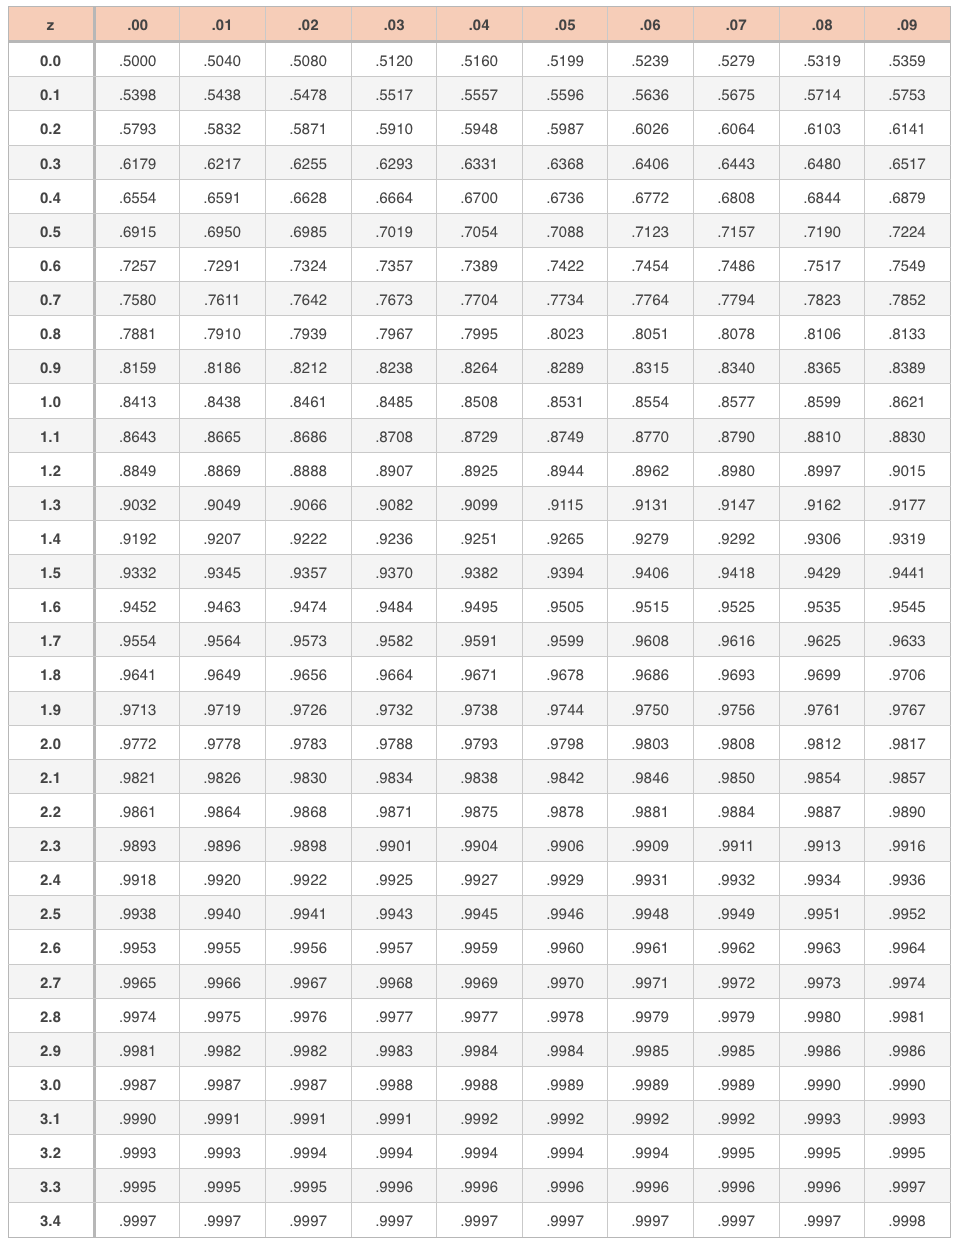
Data points that are greater than the mean will be to the right of the mean and will have a positive ???z???-score. They should be looked up in the table of positive ???z???-scores:
A ???z???-score is unusual if it’s further than three standard deviations from the mean. Essentially the ???z???-score tells us the percentile rank of the data point that we started with. If the ???z???-score for our data point is ???0.7123???, it means that the data point is greater than ???71.23\%??? of the data, meaning that our data point is in the ???71.23??? percentile.
Remember, the ???z???-table always gives you the percentage of data that’s below your data point. Therefore, to find the percentage of data above your data point, you have to take ???1??? minus the value from the table.
Thresholds
Sometimes we want to know the threshold, or cutoff, in our data set. In other words, we might want to know “What’s the minimum value needed in order to be in the “top ???10\%???” of the data?
In order to figure this out, we need to work backwards starting from the ???z???-table. For example, if we want to find the top ???30\%??? of the data, we’d use the ???z???-table to find the first ???z???-score that’s just barely above ???70\%???, or ???0.7000???. Then we’ll look at the row and column headers that correspond with a ???z???-table value of ???0.7000???. The decimal number given by the row and column headers tells us how many standard deviations above the mean we need to be in order to be above ???70\%???, or, in the top ???30\%???.
If we multiply that decimal number by the standard deviation, and then add the result to the mean, that will tell us the value that’s at the bottom of the top ???30\%???. If instead we were looking up the “bottom ???40\%???” in the ???z???-table, we’d need to look for the ???z???-table value that’s just under ???0.4000???.
How to find z-scores from the mean and standard deviation


Take the course
Want to learn more about Calculus 1? I have a step-by-step course for that. :)
How to guarantee your percentile based on the mean and standard deviation
Example
Let’s say the mean finishing time for male speed skaters at the winter Olympics on the ???500??? meter track is ???70.42??? seconds, with a standard deviation of ???0.34??? seconds (the data is normally distributed). What is the maximum time a skater can post if he wants to skate faster than ???95\%??? of his competitors?
We know that ???\mu=70.42??? and ???\sigma=0.34???. This athlete wants to be faster than ???95\%??? of the event’s participants, which means he wants his time to be in the fastest ???5\%???.

Normal distributions follow the empirical rule, also called the 68-95-99.7 rule.
Since that means he wants his time to be in the top ???5\%??? of finishers, which is equivalent to having a finishing time in the fastest ???5\%??? of all finishing times, which is equivalent to having a value in the bottom ???5\%??? of the normal distribution, we need to look in a ???z???-table for the negative ???z???-score that will keep us under ???0.05???.
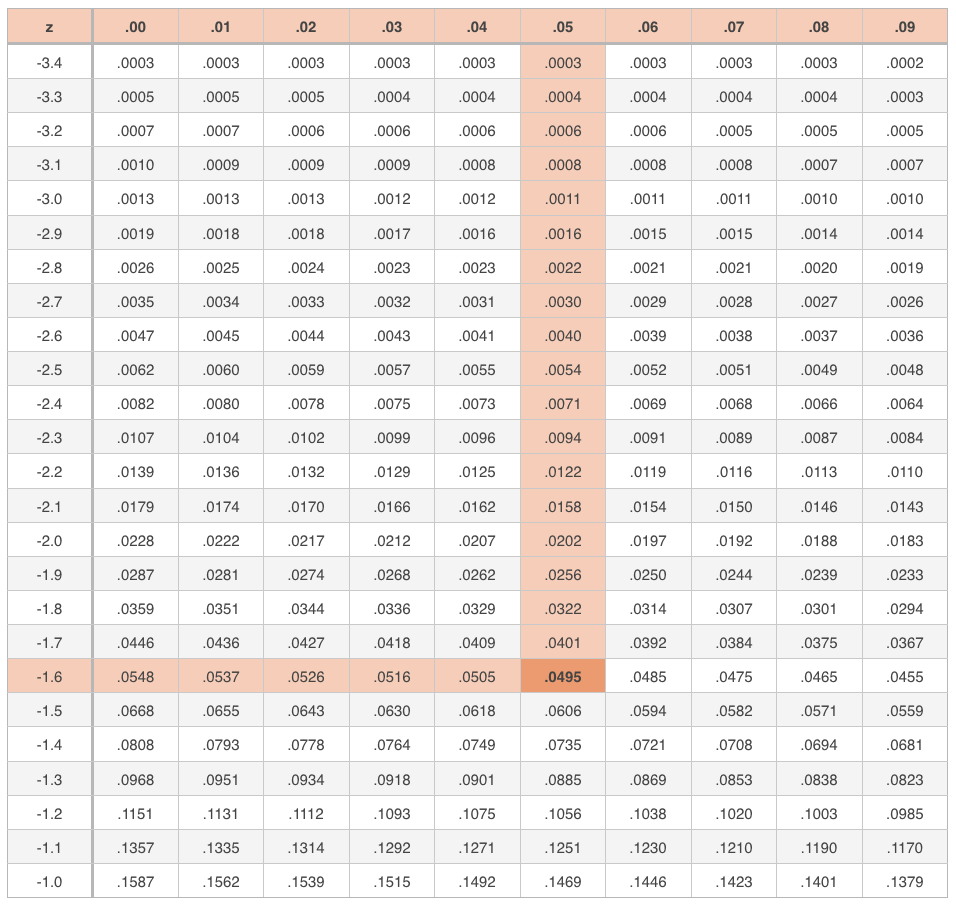
The ???z???-score that keeps us within the top ???5\%??? of participants is ???-1.65???. A ???z???-score of ???-1.64??? would push us into the bottom ???95\%??? of competitors, over the ???5\%??? threshold.
If our standard deviation is ???\sigma=0.34???, then a ???z???-score of ???-1.65??? would be
???0.34(-1.65)=-0.561???
Therefore, if the skater’s time is
???70.420-0.561???
???69.859??? seconds
or faster, he’ll be within the top ???5\%??? of competitors in the event.
