Sketching parametric curves by plotting points
Steps for sketching the parametric curve
To sketch a parametric curve, we’ll follow these steps:
Create a table where we find ???x???- and ???y???-values based on specific parameter values of ???t???.
Eliminate the parameter to find a cartesian equation in terms of just ???x??? and ???y???.
Sketch the parametric curve.

Hi! I'm krista.
I create online courses to help you rock your math class. Read more.
How to sketch a parametric curve by plotting individual points in the coordinate plane


Take the course
Want to learn more about Calculus 2? I have a step-by-step course for that. :)
Plotting points to sketch the parametric curve over a particular interval
Example
Sketch the parametric curve.
???x=\sin{t}???
???y=\cos{t}???
???0\le{t}\le2\pi???
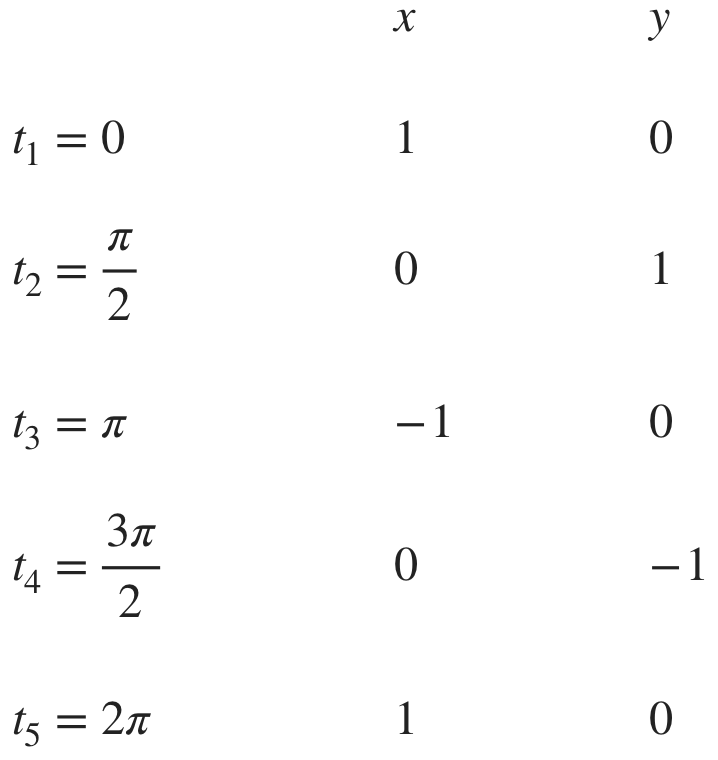
Let’s create a table of ???x???- and ???y???-values based on parameter values of ???t??? inside the given interval. Since the interval is given as ???0\le{t}\le2\pi???, we’ll choose well-known parameter values inside this interval so that they’re easy to plug into our equations for ???x??? and ???y???.
Now we’ll eliminate the parameter to find a cartesian equation that represents our parametric equation. If we remember that ???\sin^2{t}+\cos^2{t}=1???, we can just square our parametric equations,
???x=\sin{t}???
???x^2=\sin^2{t}???
and
???y=\cos{t}???
???y^2=\cos^2{t}???
and then plug them into the identity.
???\sin^2{t}+\cos^2{t}=1???
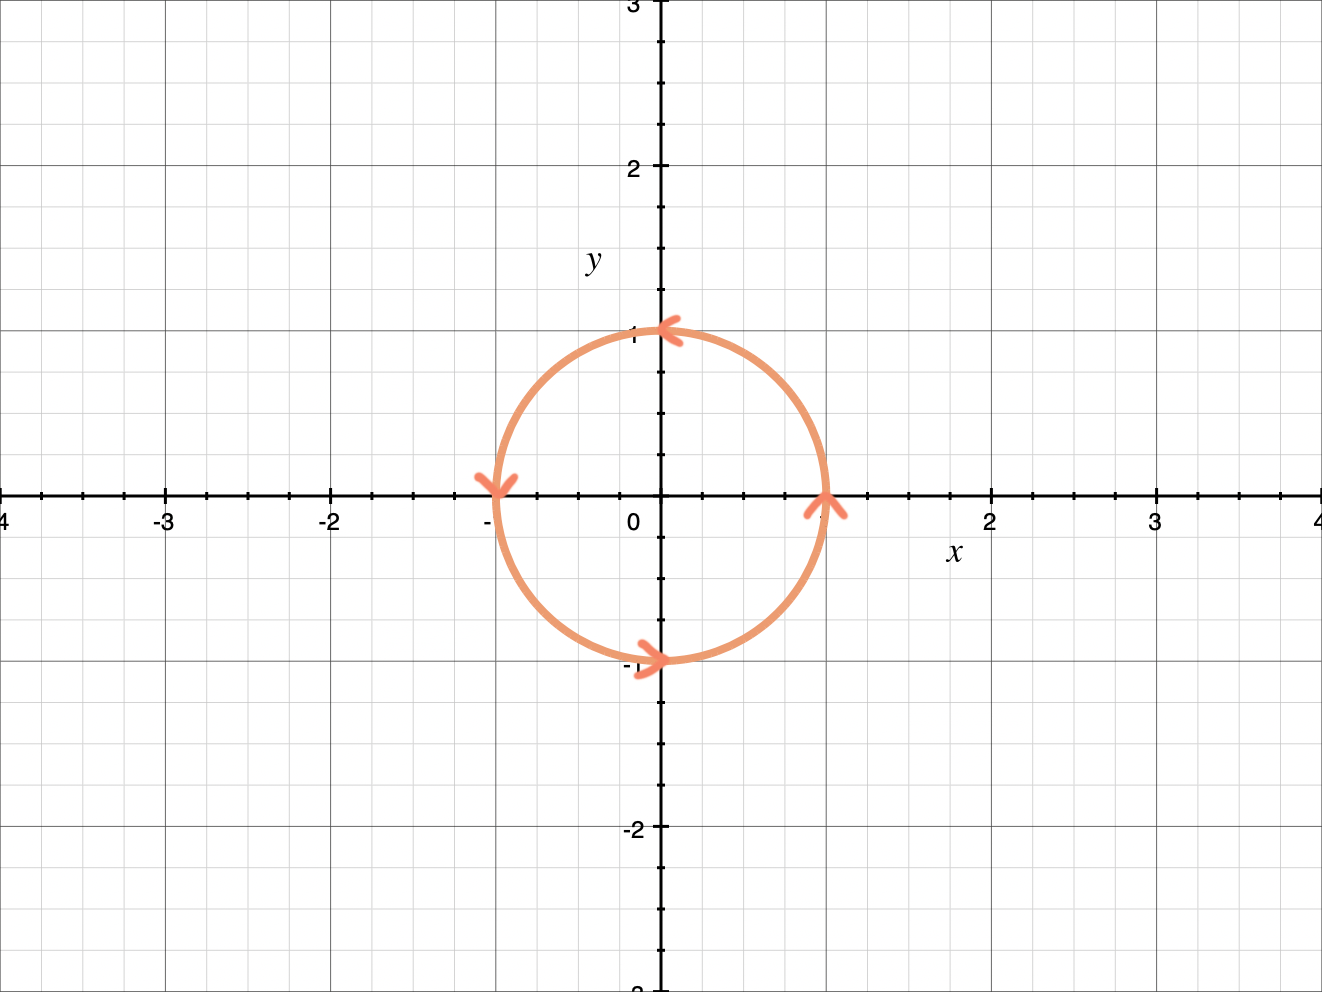
???x^2+y^2=1???

Let’s create a table of x- and y-values based on parameter values of t inside the given interval.
Since we have a list of points to plot and we know our cartesian equation, we can sketch the parametric curve. When we plot the points following the direction of the parameter ???t???, we’ll see that the parameter is moving counter-clockwise around the circle.