
Graph sketching to model word problems

How to model word problems with graphs
In this lesson we’ll look at how we can use simple concepts to sketch the graph of a piecewise function from a story problem that represents the function.
In word problems, a horizontal line represents something staying the same. A positive slope shows an increase in something, and a negative slope shows a decrease in something. The steepness of the slope can show how fast something is happening.

Hi! I'm krista.
I create online courses to help you rock your math class. Read more.
Let’s look at some example graphs to get an idea of how this works. First we’ll compare the height of an object with respect to time. The graph below tells us that, as time goes on, the height of the object is staying the same.

In both of the following graphs the height of the object is increasing because the line has a positive slope.

A shallower line, like the first graph, means that height is increasing at a slower rate. A steeper line, like the second graph, means that the height is increasing at a faster rate.
In both of the following graphs the height of the object is decreasing because the line has a negative slope.

A shallower line, like the first graph, means the height is decreasing at a slower rate. A steep line, like the second graph, means that the height is decreasing at a faster rate.
Examples of how to sketch story problems


Take the course
Want to learn more about Algebra 2? I have a step-by-step course for that. :)
Writing a story for a given graph
Example
Emily left on a trip to go to her grandmother’s house in her car. The graph below shows her distance from her house over time. Write a possible story to go along with the graph.
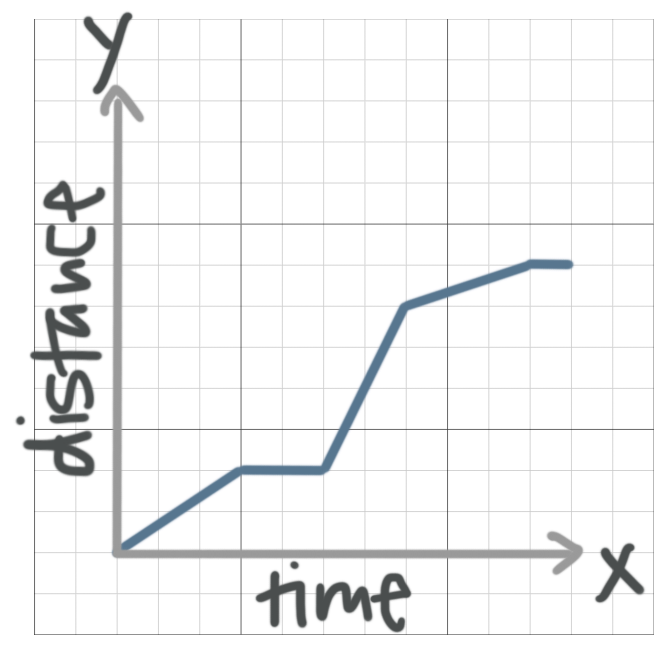
Looking at the graph, Emily has two places where she drives slowly and one place where she drives more quickly. There are also two horizontal lines, so there are two places where Emily stopped. The last is most likely her grandmother’s house. We can make up a story around what happens in the graph, anything that follows this scenario could work.
We could say something like:
Emily left her house and drove along the road in town, then stopped for gas. After stopping for gas she drove more quickly on the highway. When she got off the highway, she drove more slowly through a neighborhood, and then arrived at her grandmother’s house, where she stopped.

In word problems, a horizontal line represents something staying the same. A positive slope shows an increase in something, and a negative slope shows a decrease in something.
Matching a story to the graph
Example
A bulldozer is filling in a hole, then it slows down and breaks. After it’s repaired, it fills in the hole quickly. Which graph best shows how deep the hole is as time goes on?
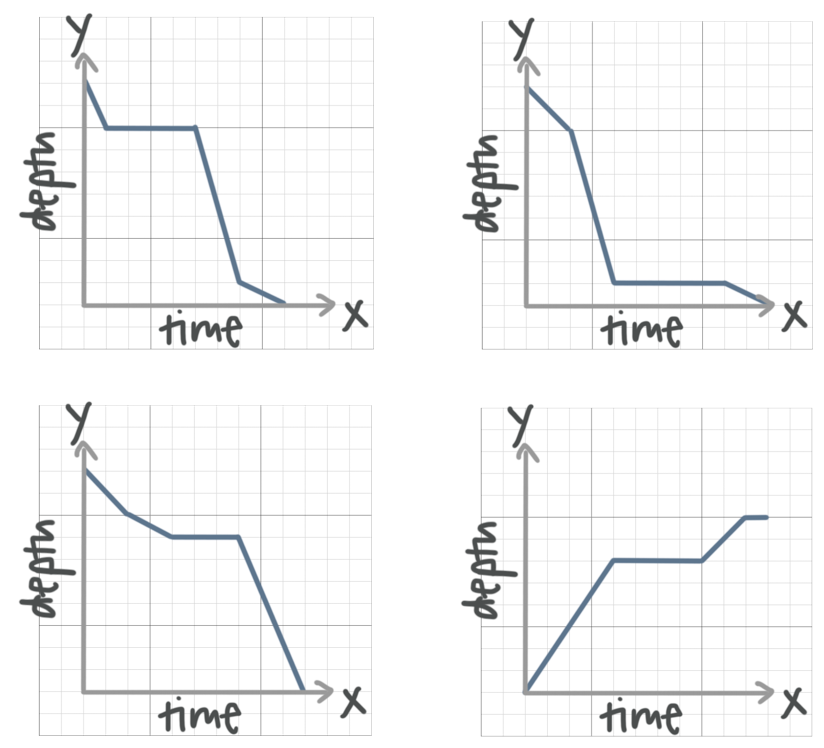
The depth of the hole should be decreasing as time goes on, so we need a graph that has negative slopes. At first the machine is working so the slope should be steep and negative. Then the bulldozer slows down so the slope should be less steep but still negative. While the bulldozer is being fixed the hole remains at a constant depth, then the bulldozer gets fixed and fills in the hole at the steep negative slope. The only graph that fits this story is

