
All about Venn diagrams

Using Venn diagrams to represent two-way data
We’ve seen how we can express data in a two-way table, and then translate that data into bar and line graphs.
But we can also express data from a two-way table in a different visualization called a Venn diagram.

Hi! I'm krista.
I create online courses to help you rock your math class. Read more.
Let’s say you’re baking sugar cookies for your family for Christmas. Like any good baker would, you want to categorize your cookies by making a chart that describes how many of each kind of cookie you have. Here’s a picture of all of your sugar cookies:

The ones with the red section are dipped in red frosting. The ones with the white dots are covered in white sprinkles. As you can see, some of your cookies have both frosting and sprinkles, and some don’t have either frosting or sprinkles.
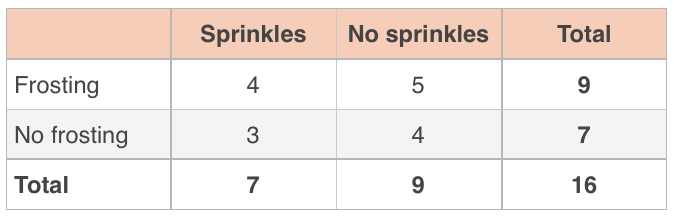
Let’s apply what we already know and represent this data in a two-way table. We’ll go ahead and include totals as well.
A Venn diagram representing this data might look like this:
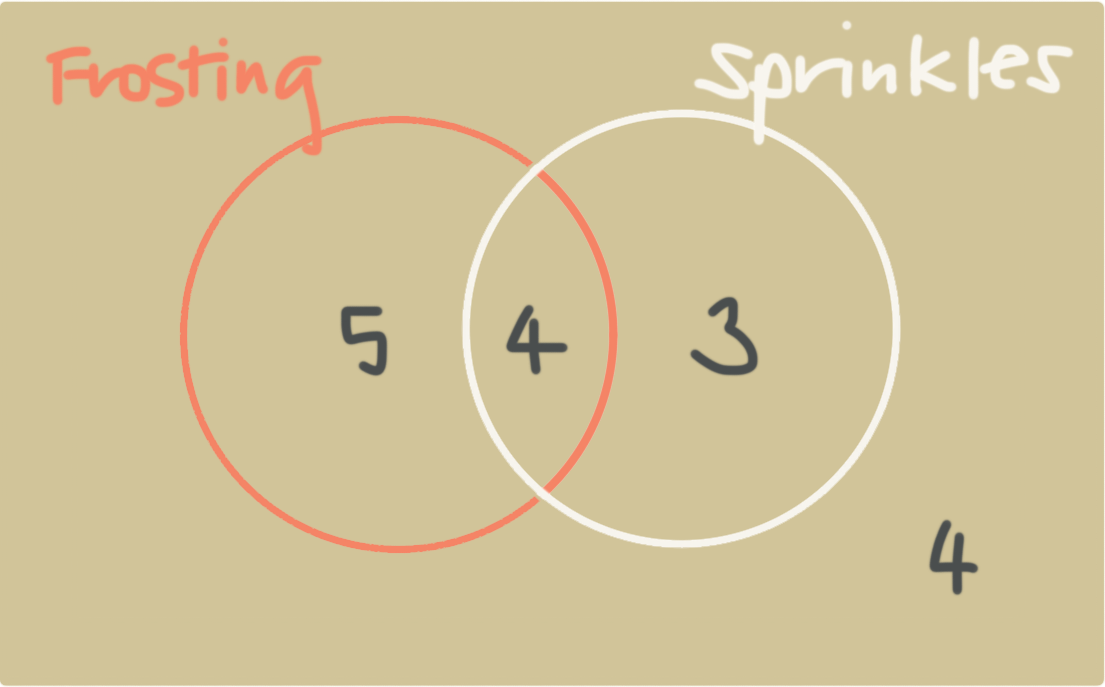
Let’s walk through this. The red circle represents the cookies with frosting and the gray circle represents cookies with sprinkles.
Because we put a ???5??? inside the red circle but outside the white circle, it means there are five cookies that have frosting but no sprinkles.
Because we put a ???3??? inside the white circle but outside the red circle, it means there are three cookies that have sprinkles but no frosting.
Because we put a ???4??? inside both circles in the middle, it means there are four cookies that have both frosting and sprinkles.
Because we put a ???4??? outside both circles in the corner, it means there are four cookies that don’t have either frosting or sprinkles.
From the Venn diagram, we can also see that there are
???5+4=9??? total cookies with frosting,
???4+3=7??? total cookies with sprinkles,
???5+4+3=12??? total cookies that have at least frosting or sprinkles or both, and
???5+4+3+4=16??? cookies total
Notice that all of these numbers match the data in the two-way table.
So when we construct a Venn diagram, we put the number of items that only meet one condition in one circle, we put the number of items that only meet the other condition in the other circle, we put the number of items that meet both conditions in the middle where the circles overlap, and we put the number of items that meet neither condition outside of all the circles but inside the box.
Variations of Venn diagrams
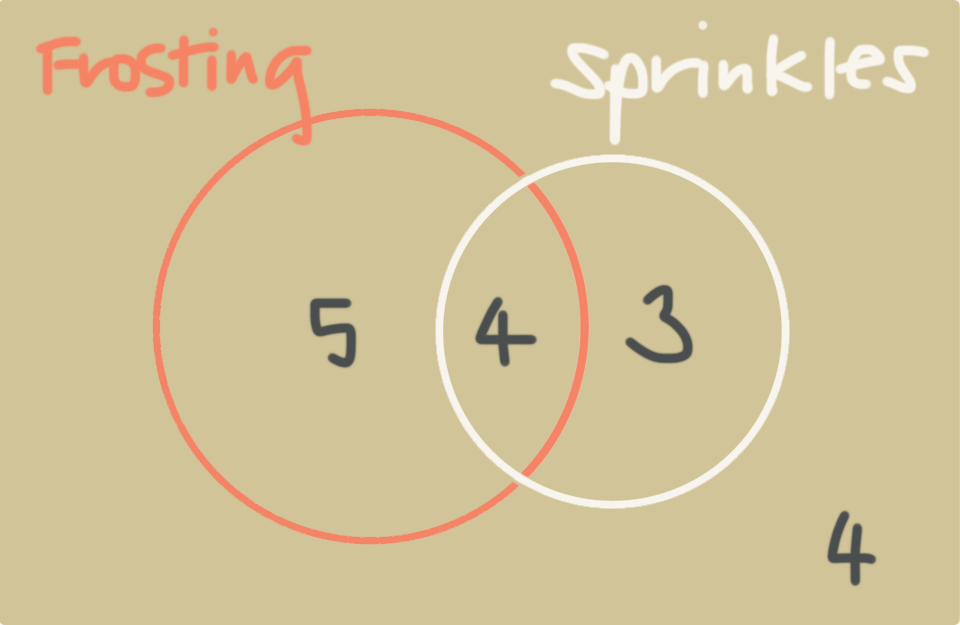
You can also construct Venn diagrams with circles of different sizes, where the size of each circle is proportional to the number of items it represents. So if we take the Venn diagram we made earlier for the cookies, we could adjust the circles so that the ratio of the frosting circle to the sprinkles circle is ???9:7???, since there are ???9??? cookies with frosting, and ???7??? circles with sprinkles.
We can also create Venn diagrams with more than just two circles. For instance, suppose we asked students about their favorite kind of pet, and collected the following data.
???2??? students like dogs, but not cats or birds
???3??? students like cats, but not dogs or birds
???1??? student likes birds, but not dogs or cats
???3??? students like dogs and birds, but not cats
???5??? students like dogs and cats, but not birds
???4??? students like cats and birds, but not dogs
???6??? students like dogs, cats, and birds
???7??? students don’t like any kind of pet
Even though there are three kinds of pets in this survey, dogs, cats, and birds, we can still construct a Venn diagram that models student preferences.
Let’s use a brown circle for students who like dogs, a blue circle for students who like birds, and black circle for students who like cats.
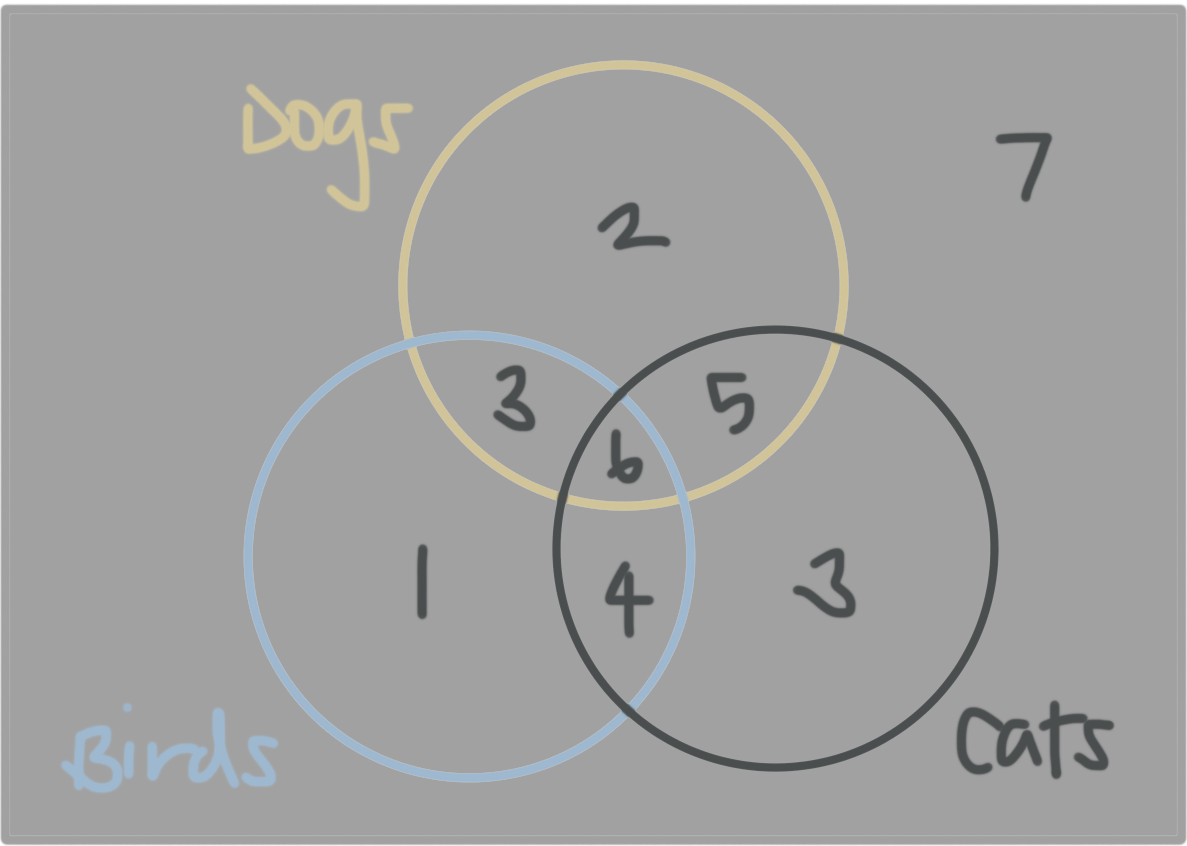
From the diagram, we can see that,
Because we put a ???2??? inside the brown circle but outside the black and blue circles, it means ???2??? students like dogs only.
Because we put a ???3??? inside the black circle but outside the brown and blue circles, it means ???3??? students like cats only.
Because we put a ???1??? inside the blue circle but outside the brown and black circles, it means ???1??? student likes birds only.
Because we put a ???3??? inside the overlap of the blue and brown circles but outside the black circle, it means ???3??? students like dogs and birds, but not cats.
Because we put a ???5??? inside the overlap of the brown and black circles but outside the blue circle, it means ???5??? students like dogs and cats, but not birds.
Because we put a ???4??? inside the overlap of the blue and black circles but outside the brown circle, it means ???4??? students like birds and cats, but not dogs.
Because we put a ???6??? inside the overlap of the blue, brown, and black circles, it means ???6??? students like birds, dogs, and cats.
Because we put a ???7??? outside all three circle circles in the corner of the Venn diagram, it means ???7??? students don’t like any kind of pet.


